Developing a Minimum Viable Web Application for Visualizing Multi-drug Interactions Based on Previous Research
26 February, 2017
A demo of our project is located at diva.wpi.edu:3000
This is our placeholder abstract. Like all pandoc metadata sections it supports markdown syntax.
These are placeholder acknowedgements. Use markdown syntax for formatting.
This is text under a heading.
This is a placeholder Executive Summary. Again, use markdown syntax in this block.
It can handle multiple paragraphs.
More than 100,000 deaths, and 2 million hospitalizations, annually, are caused by the side effects of prescribed drugs or the unintended interactions from taking several drugs at once (“Preventable Adverse Drug Reactions: A Focus on Drug Interactions” 2016). These side effects, called Adverse Drug Reactions (ADRs), create a public health problem that makes it one of the leading causes of death worldwide. While the ADRs directly caused by a single drug are well-researched, often documented well before drugs reach the public market, there is much less documentation about how drugs will act in combination with each other. Polypharmacy, or having multiple drugs prescribed at once, affects more than 40% of elderly people living at home and some of these patients regularly take up to 18 different drugs. The number of combinations of drugs that are taken together is far larger than can be researched in depth by medical professionals, so it is necessary to have tools that can use patient data to assist researchers in identifying probable candidates for multi-drug interactions.
Originally developed by Xiao Qin and Tabassum Kakar (Kakar 2016, Kakar and Qin (2017–2018)), the Multi-Drug Adverse Reaction Analytics Strategy (MARAS) and Drug-Drug Interactions via Visual Analysis (DIVA) systems are designed to aid analysts in discovering these multi-drug interactions. MARAS focuses on mining FAERS, a dataset provided by the FDA that contains ADR reports submitted around the globe, to find groups of drugs likely to be contributing to Multi-drug Adverse Reactions (MDARs), sorted by a severity score. DIVA, on the other hand, focuses on visualizing the 2-drug interactions found by MARAS. It allows users to see the network of interactions at a glance and find the raw FAERs reports contributing to the groupings found by MARAS.
For these tools to be used by professional analysts, they need to be tightly integrated, efficient, and stable. Our project evaluated the MARAS and DIVA systems as they were previously, implemented improvements in code quality and performance, and integrated the systems into a fully-functional web application that can be used by analysts to discover new MDARs from FAERS data. We focused on the usability and maintainability of the system, while also developing additional features and designs, to ensure that FDA employees and other analysts can utilize the application as effectively as possible. The DIVA software can improve the speed, efficiency, and accuracy of MDAR discovery and allow the FDA to more efficiently identify and publicize these dangerous interactions.
When patients experience unwanted symptoms while taking a drug, they submit reports, called Adverse Drug Events (ADEs), to an FDA-run database, the “FDA’s Adverse Event Reporting System” (FAERS) (“Questions and Answers on Fda’s Adverse Event Reporting System (Faers)” 2017). As more and more people are being prescribed multiple drugs, the amount of ADEs sent to FAERS is increasing rapidly. This database receives millions of new records every year, which makes it impossible for current tools to take full advantage of the amount of data being collected. There needed to be a system that was able to use the wealth of data in the FAERS database to allow drug evaluators make informed decisions about where to focus their lab research.
This niche requires an application that can provide evaluators an at-a-glance overview of the possible drug interactions indicated by the data, as well as a system for understanding which associations are the most common or most severe in order to inform investigator priorities.
Analyzing the multitude of drug interactions requires both a back-end mining algorithm that can report on the most common or likely combinations of drugs and an interface that can allow evaluators to quickly understand those interactions and then dive deeper into individual reports to study further. Our graduate student partners (Kakar 2016, Kakar and Qin (2017–2018)), researched two techniques that address the back-end space and interface separately. Kakar and Qin created the Multi-drug Adverse Reactions Analytic System (MARAS), which ranks mined associations by their ‘contrast score’ a metric that quantifies how closely an ADR is associated with a pair of drugs rather than each drug individually.
They also developed the Drug-Drug Interactions via Visual Analysis (DIVA), which is a web visualization combining several different views to allow the interactions—found and ranked in MARAS—to be analyzed in different contexts within the same application. Unfortunately, these two projects were conducted largely independently, and it was an intensive, manual process to take the associations ranked in MARAS and integrate them into the DIVA web visualization.
Our project focused on developing a minimum viable product to demonstrate how Kakar and Qin’s work could be used to assist evaluators researching multiple-drug adverse reactions. We unified MARAS and DIVA into a single application, the Multiple-drug Interaction Analytics Platform (MIAP), which focused on creating a smoothly interactive user experience that highlighted the contributions to the state-of-the-art in Multiple Drug Interaction Analysis by Kakar and Qin, our graduate student partners in the project.
To be a minimum viable product, our project demonstrated the capability to:
Future work can conduct experiments on the customer value of MIAP, determining how valuable a tool like it would be to evaluators. If the system is found to be worth developing further to improve upon MIAP and create an application that fulfills all features required of a software suite that can facilitate the complete evaluation process. This requires research in determining exactly what other workflows in the MDAR evaluation process should be integrated into a single application.
The Food and Drug Administration (FDA) is responsible for approving drugs for medical use and for keeping up-to-date on the risks associated with taking those drugs. The Center for Drug Evaluation and Research (CDER) is the specific department at the FDA that is responsible for ensuring that “safe and effective drugs are available to ensure the health of people in the United States” (???). This department regulates both over the counter and prescription drugs, from fluoride toothpaste and sunscreen to narcotic painkillers and cancer medications.
One part of this is ensuring that drugs continue to stand up to safety measures after they’ve gone to market. Clinical trials cannot explore all the ways that using a drug might be harmful, so the FDA must rely on data collected from patients and hospitals during the course of their usage. One tool that the FDA uses is by collecting reports on Adverse Drug Reactions.
An Adverse Drug Reaction (ADR), or adverse event, is defined by the Food and Drug Administration (FDA) as an “untoward medical occurrence associated with the use of a drug”. Every year, there are over 2 Million serious ADRs, resulting in over 100,000 deaths(“Preventable Adverse Drug Reactions: A Focus on Drug Interactions” 2016). ADRs are the fourth leading cause of death, surpassing automobile deaths, diabetes, and pulmonary disease. In addition, over 350,000 ADRs occur in nursing homes annually. To gather information on ADRs, the FDA uses FDA’s Adverse Event Reporting System (FAERS)(“Questions and Answers on Fda’s Adverse Event Reporting System (Faers)” 2017). The FAERS database contains information on ADR reports submitted to the FDA by healthcare professionals and consumers. With the mass of ADRs reported through FAERS the lack of automated tools to perform preliminary analyses limits the usefulness of the data collected.
An interaction between multiple drugs causing one or more ADR(s) (such as taking Aspiring and Warfarin together causing bleeding) is known as a Multi-Drug Adverse Reaction, or MDAR. One of the more difficult analyses to extract from these data is multiple-drug interactions. Up to 40% of elderly people are prescribed more than six medications simultaneously, in so many different combinations that testing them all, individually, for side effects that are derived from the interaction between two or more of those drugs impossible.
In order to create an automated screening process for which sets of drugs are candidates for causing MDARs, Kakar (2016) developed the Multi-drug Adverse Reactions Analytic System (MARAS).
MARAS utilizes Association Rule Learning to identify ADRs which are most significant. There are several challenges associated with using Association Rule Learning with ADRs. Applying Association Rule Learning to a large set of drugs and ADRs, such as the set generated by FAERS, results in an excessively large number of associations. It is difficult to reduce the number of rules to a manageable scale while still guaranteeing that potentially important rules are not missed. In addition, the basic association measures used with Association Rule Learning, such as support and confidence, do not appropriately rank drug-ADR associations, because they only consider individual association rules, while MARAS has to consider the correlation among different rules. The MARAS methodology attempts to address these concerns to sufficiently filter and rank drug-ADR associations in a meaningful way.
Association Rule Learning refers to the process of creating Association Rules from a set of transactions, where an Association Rule is defined as a description of the probability that, given the occurrence of one event, another event will occur. In other words, “it helps find the relationship between objects that are frequently used together” (Gollapudi 2016). One common example of an association rule would be that if a customer purchases an iPad, they are likely to also purchase an iPad case.
The support of an association rule is the frequency with which the items appear together compared to the total number of transactions. More formally, the support of a rule \(X \rightarrow Y\) is defined as: \(Support = frq(X,Y)/N\) where N is the number of transactions.
The confidence of an association rule \(X \rightarrow Y\) is the frequency with which the items appear together compared to the frequency that \(X\) appears by itself; in other words:
\[Confidence = \frac{frq(X,Y)}{frq(X)}\]
The lift of an association rule \(X \rightarrow Y\) is the support of the rule compared to the product of the supports of \(X\) and \(Y\) individually.
\[Lift = \frac{support(X,Y)}{support(X) \times support(Y)}\]
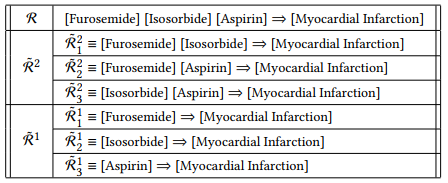
A Drug-ADR association R is a pairing of a set of Drugs D and a set of ADRs A. The association is considered explicitly supported if at least one report exists that refers exactly to the Drugs and ADRs in the association, with no others. Meanwhile, the association is considered implicitly supported if it exists as partial interpretations of two or more reports. For example, consider a report \(R_1\) with a set of drugs \(D_1 = \{d_1, d_2, d_3\}\) and a set of ADRs \(A_1 = \{a_1, a_2\}\), and a report \(R_2\) with a set of Drugs \(D_2 = \{d_1, d_2, d_4\}\) and a set of ADRs \(A_2 = \{a_1, a_2, a_3\}\). In this case, the association \(d_1, d_2, d_3 \rightarrow a_1, a_2\) is explicitly supported, since \(R_1\) refers exactly to this association. The association \(d_1, d_2 \rightarrow a_1, a_2\) is implicitly supported, because it is a partial interpretation of both \(R_1\) and \(R_2\). An association is a spurious association if it is neither explicitly nor implicitly supported.
An association is considered closed if it does not contain partial information of another association. Consider \(R_1 = d_1, d_2, d_3 \rightarrow a_1, a_2\) and \(R_2 = d_1, d_2 \rightarrow a_1,a_2\). In this case, \(R_2\) is not closed, because it presents partial information of \(R_1\). In other words, \(R_1\) provides richer information than \(R_2\).
Consider a report \(R_1\), an association of a set of drugs \(D_1\) and adverse reactions \(A_1\); similarly, \(R_2\) is an association of a set of drugs \(D_2\) and adverse reactions \(A_2\). \(R_1\) is a contextual association of \(R_2\) if \(D_1\) is a subset of \(D_2\) and \(A_1\) is a subset of \(A_2\). For example, let \(R_1 = d_1, d_2,d_3, d_4 \rightarrow a_1, a_2, a_3, a_4\); let \(R_2 = d_1, d_2 \rightarrow a_1, a_3\). In this case, \(R_1\) is a contextual association of \(R_2\). A contextual association cluster (CAC) contains an explicitly or implicitly supported association, and its contextual associations.
There are two factors to consider when measuring if a Drug-ADR association indicates a severe Multi-Drug Association Rule (MDAR): How strong the association is between the ADRs and drugs, and how strong the association is between the ADRs and each individual drug, or a subset of the drugs. For the former, we can use the traditional confidence measure, referenced above. For the latter, we can use the contrast measure. A high contrast indicates that the target association has a high confidence, and all of the contextual associations within its CAC have low confidence.
The MARAS System methodology describes how the Association Rule Learning methods detailed above can be used to present Adverse Drug Reaction information in a descriptive and informative manner. The first step in this process is the Data Processor, which extracts and cleans drug and ADR data from an ADR report (such as a FAERS report) so it is in the appropriate format to be used by the MDAR signaler; The Data Processor also removes any duplicate reports. Next, the MDAR Signaler analyzes the output of the Data Processor to identify the non-spurious Drug-ADR associations along with their Contextual Associations, then computes the contrast score of each CAC to identify the strength of the signal.
The MARAS code received at the beginning of this project consisted of two main parts. The first part of the system focused on using association learning to mine hypothetical drug-drug interactions from the FAERS data and the other part was responsible for processing and filtering the data for the data mining part and for having usable output. The processing part was further divided into three sections: preprocessing, closure generation, and result output.
The Preprocessor builds a copy of the initial data-tables pulled from the FAERS database by generating unique IDs for each drug and adverse reaction. This allows the data mining step to be run efficiently. This step outputs three files: a mapping between drug names and unique IDs, a mapping between adverse reaction names and unique IDs, and the copy of the table of adverse reaction reports using unique IDs instead of drug and reaction names.
The data mining element, implemented in C++, takes the preprocessed FAERS data and finds patterns in the data that may be associated with MDARs. To accomplish this task, the FP-growth algorithm is implemented to find the complete set of frequent patterns in the preprocessed data. After the frequent patterns have been generated, the program outputs two files to be used as input to the next element in the backend. The first file contains the frequent itemsets of drugs and their support values. Meanwhile, the second file contains rules indicating a potential causal relationship between a drug combination and an adverse drug reaction.
After all the rules are generated, they can be ranked using the Contrast Score. However, due to size of the dataset, it would be inefficient to calculate the score for every single rule reported in the last step. Therefore there is a filtering step that ignores every rule that is entirely contained by another rule.
For example, this filtering step would ignore a rule that suggests Aspirin and Excedrin lead to nausea if there is also a rule that suggests Aspirin and Excedrin lead to nausea and headaches. This prevents needless computation.
The final step in the MARAS program is generating results for use in DIVA. The final program, Explorer, sorts the list of rules by their contrast score, returning only the highest scoring. It creates three reports, one which contains the MDARs and all associated information in a human-readable format, one which has the support, confidence, and score in three comma-delimited columns, and a third which contains the same information as the fist file in a comma-delimited format.
DIVA (Kakar and Qin 2017–2018) was developed in consultation with evaluators from the FDA, who are domain experts in the field of drug-safety research with focuses on multi-drug interactions, to ensure a complete understanding of the current drug safety review process and the challenges associated with analyzing Drug-Drug Interactions. The consultations with these evaluators helped Kakar and Qin develop a list of requirements for an application that could successfully assist in safety research in multi-drug interactions. The requirements from Kakar (2016) are discussed below.
Listing 1: DIVA Requirement 1
Provide an overview of all Hypothetical Drug-Drug Interactions (HDDIs)The simplest requirement is that evaluators need to have a method for easily scanning for interesting HDDIs. They need to be able to identify those interactions that are heavily supported by the data, so that they can focus on those. That led to the second requirement:
Listing 2: DIVA Requirement 2
Facilitate the detection of interesting HDDIsThis means that, in the visualization, hypothetical interactions that are well-supported in the data must be visually distinct from those that are not well-supported. This distinction must be clear enough that the most interesting HDDIs are easy to separate from the least interesting ones. This requirement also seems to encourage the ability to filter away the least interesting HDDIs.
Listing 3: DIVA Requirement 3
Enable analysts to change importance criteria for HDDIs interactivelyContinuing the idea of filtering, this requirement shows that the different ways that evaluators could prioritize the hypothetical interactions must all be a part of the visualization, and switching focus between them must be easy.
Listing 4: DIVA Requirement 4
Facilitate detection of severe ADRsThose reactions that are immediately life-threatening are more urgent than those that only cause mild discomfort, so it is important to find the most dangerous ADRs, so that they can be prioritized.
Listing 5: DIVA Requirement 5
Facilitate prioritization of drugsThe previous requirements also centered around the concept of prioritization, where evaluators wanted to not only filter away uninteresting hypothetical interactions, but also to have a way to choose an order for evaluators to examine interactions. This would allow for a project manager to choose an order of prioritization for a team of evaluators to work on.
Listing 6: DIVA Requirement 6
Link to underlying reportsWithout access to the underlying report data, the visualization is hard to draw any conclusions from. There is significant information useful to evaluators in the reports sent to FAERs, and that needs to be accessible from the visualization.
Listing 7: DIVA Requirement 7
Support custom annotations on MDARsIf the evaluators want a single application to provide the entire toolchain for MDAR analysis, notetaking is indispensible. Requirement 7 allows for evaluation periods to take longer than one sitting, and evaluators could save their notes between sessions.
Listing 8: DIVA Requirement 8
Support smooth and interactive exploration of FAERs dataUsability is important for any new application that gets introduced to a work environment. Requirement 8 reinforces that priority.
Listing 9: DIVA Requirement 9
Use familiar visual metaphors and respect the user's mental model about
drugs and ADRs
A significant part of usability is concerned with the learning curve for new users. Part of minimizing the difficulty of learning a new system is relying on metaphors that the users would already be familiar with, either from applications they use in other areas of their work, or in daily computer use. That is the purpose of Requirement 9.
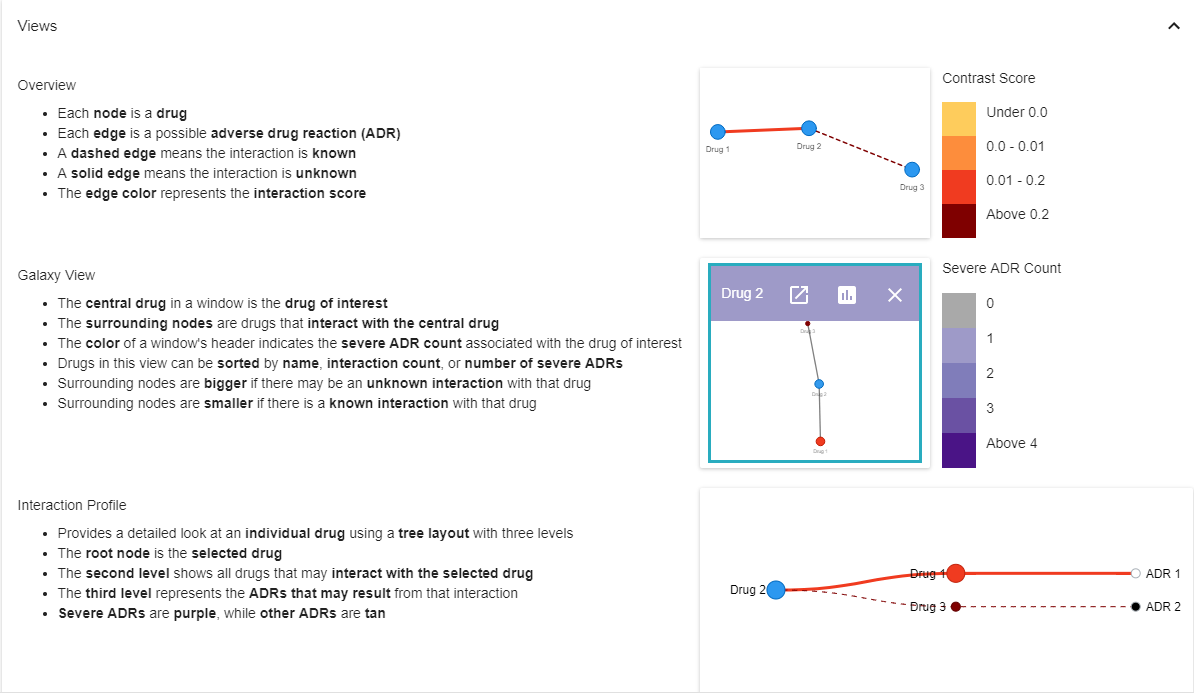
In order to fulfill these requirements, DIVA uses four main interactive views: Overview, Galaxy View, Profile View, and Reports view.
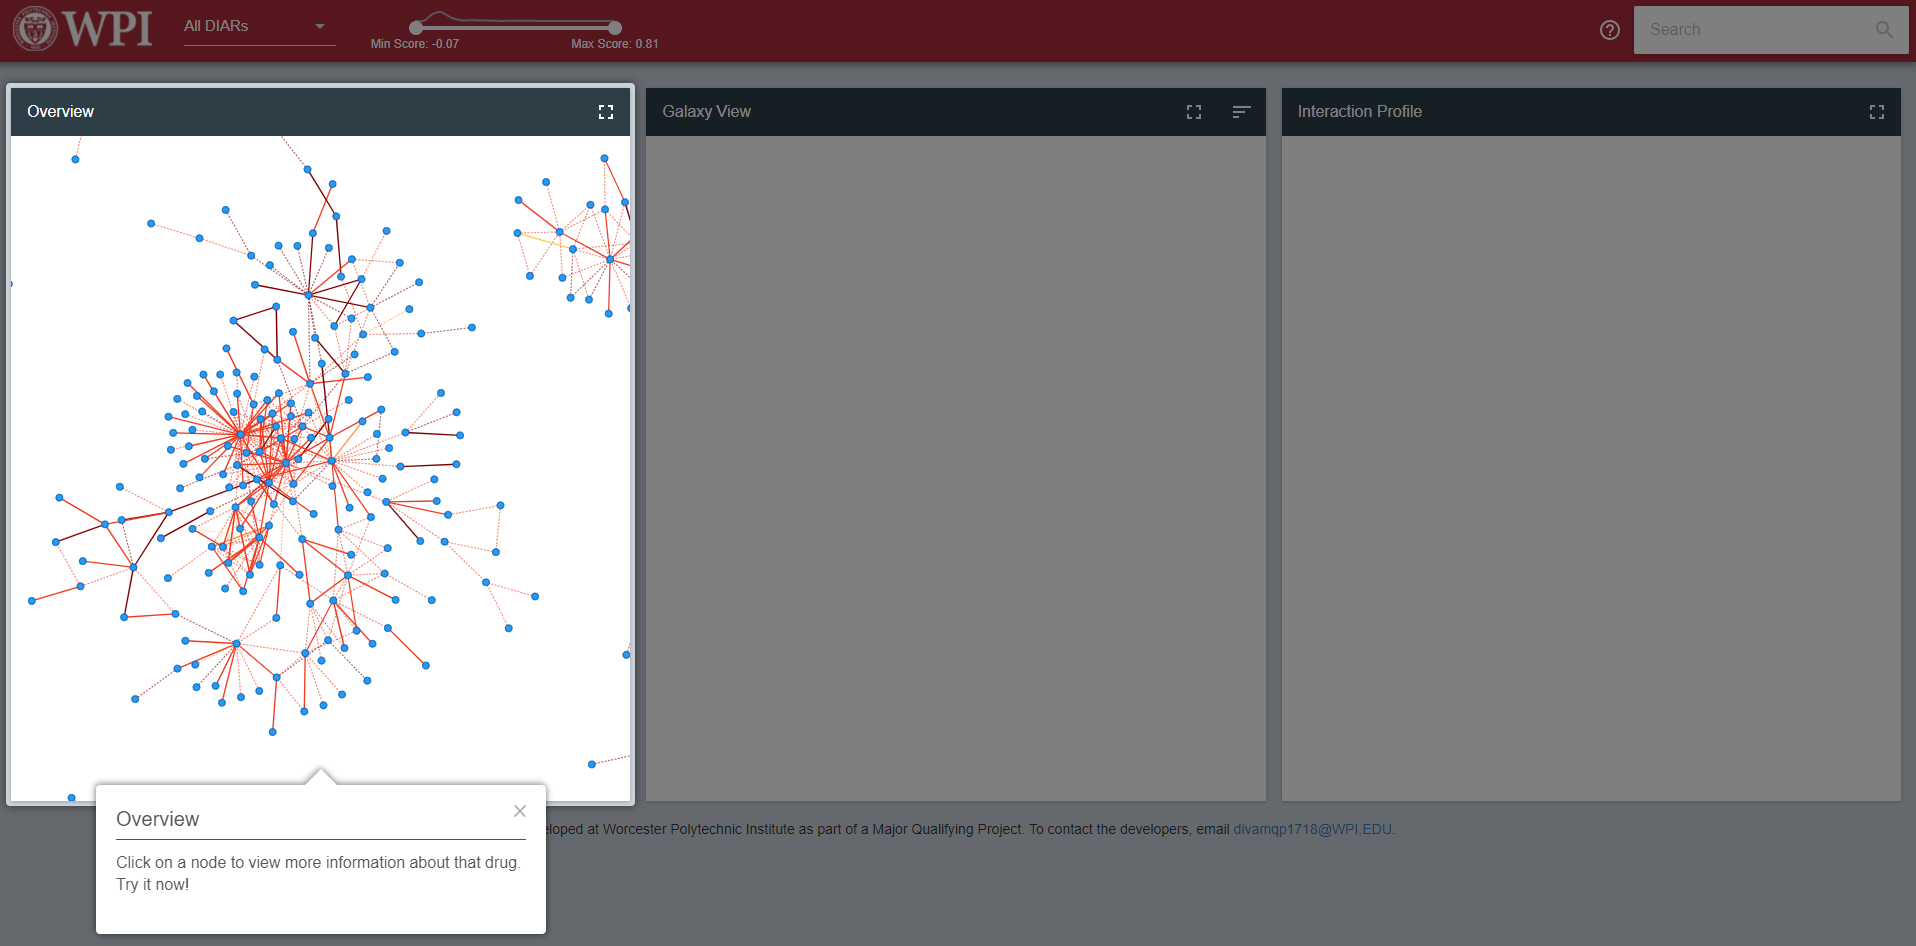
The Overview allows users to analyze MDARs at a macroscopic level; this view shows the entire space of HDDIs.
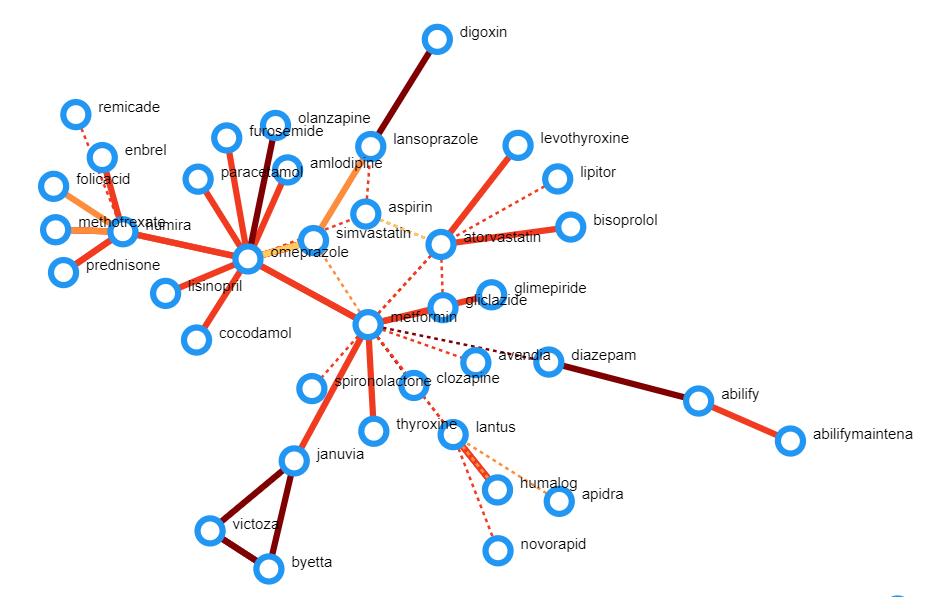
This view utilizes a node-link diagram to visually display relationships between drugs and ADRs. In this view, nodes represent drugs and edges represent an interaction between two drugs. If the edge is a dashed line, the interaction is known; if the edge is a solid line the interaction is unknown. The color of each edge represents the contrast score of the interaction.
The Galaxy View allows analysts to quickly get an overview of MDARs associated with a specific drug.
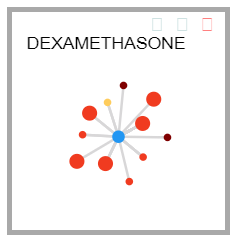
The center node of the Galaxy View represents the drug of interest, while the nodes surrounding it represent the drugs that interact with that drug of interest. The color of the box surrounding this view indicates the count of severe ADRs associated with this drug. Users can view multiple different drugs at a time, sorted by name, interaction count, or severity as necessary. The size of each individual node indicates whether any of the MDARs between the two drugs are unknown; if there exists at least one unknown MDAR, the node will have a larger size than those with no unknown MDARs. Users can find additional information about each interaction by hovering over them.
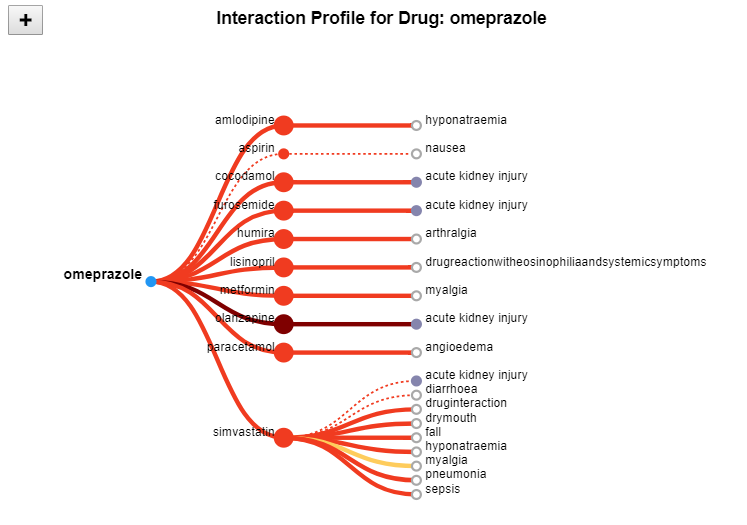
The Drug Profile View provides a more detailed look at an individual drug in the form of a modified tree layout, consisting of three levels. The root node represents the selected drug, the second level displays all of the drugs that interact with the selected drug, and finally, the third level represents the ADRs that exist between the drugs. Normal ADRs are represented with a tan color, while severe reactions are labelled purple.
The Reports View allows analysts to view the raw data directly. This view shows a list of all reports related to a chosen drug or drug interaction, enabling the user to see the underlying information related to a drug or ADR.
In Lean Startups, a minimum viable product (MVP) is “an experimental object that allows for empirical testing of value hypotheses” that has been “built with a minimum amount of effort and development time” (Münch et al. 2013, 138). A value hypothesis tests if a product is capable of being valuable to its customers once they are using it. Used in conjunction, they create an experimentation tool that allows developers to determine if it is worth developing further.
Minimum viable products take many forms, depending on the type of project being tested. Some projects can test if they would get customer engagement with merely a landing page listing the planned features. In more established industries, it is often necessary to evaluate the value of a particular style of a feature and therefore a more developed MVP is required.
This project is focused on preparing the research conducted by Kakar and Qin for experimentation that can determine the value of their work to the FDA. We are creating a minimum viable product from the two research projects detailed above, to test the value hypothesis that an application that mines and ranks hypothetical drug-drug interactions from FAERS data and then serves a visualization fulfilling the requirements above provides valuable assistance in detecting and evaluating MDARs.
The individual MARAS and DIVA tools relied on each other to be useful for analysis by FDA evaluators, our target use case for this project. DIVA requires data showing the drug interactions in order to create a meaningful visualizations and MARAS, despite filtering and ranking the initial FAERS reports to focus on the interactions, creates far too much data to analyze textually. Thus it was vital that they be unified into a single system, which we called MIAP, the Multiple-drug Interaction Analytics Platform. The first phase of our project was to unify the tools, as they currently existed, into a single toolchain.
In order to accomplish this, we divided that task into two parts. Firstly, we reviewed the current codebase of both projects in order to decide on the cleanest way to integrate them. This involved a line-by-line reading of both systems. Then we refactored each project to be more maintainable, using published libraries, reducing the number of programming languages required, and focusing on applying standard software engineering practices to the development of each program. In essence, we rewrote each tool from scratch to ensure that they would work in concert without human intervention.
In order to learn how the preexisting DIVA and MARAS systems functioned, the team decided to split the code up and perform in-depth analysis of the code and its functions. This decision was made because the preexisting code had little documentation and was difficult to understand without tracing the actions of the code line-by-line. Therefore, as part of the Deep Dive process, the team generated documentation to improve the code’s readability and facilitate future efforts to refactor the code.
As the MARAS codebase was written in two languages (JAVA and C++), we divided the code review into two subtasks—one for analyzing the JAVA codebase, focusing on data transformation and score calculation, and the other concentrating on the C++ code for mining frequent itemsets and association rules. The two code-bases only interacted by reading the files created by the other applications and this lack of logical interactions between the two sections of the existing code made this division of labor sensible.
The codebase was further divided into 4 separately executed steps: Preprocessing, Rule Mining, Closure Generation, and Score calculation. These correspond to the four steps specified in Sec. 2.1. The rule mining step was performed in C++, while the other three steps used JAVA code only.
The JAVA code was built around three main objects: Itemset, Rule, and Group. It also includes three executable classes: Preprocess, ProcessFI, and Explorer. As a whole, while there was no documentation, either inline, or at a JAVAdoc level, this module was fairly straightforward to analyze.
Of the three executable classes, Preprocess was the only one which did not interface with the data objects. After reading in the database of Adverse Drug Reactions, it created three files. The first two files were a unique mapping of the drugs and reactions referenced in the database. The third file applied that mapping to the database to create a list of reports where each report was made of the unique identifiers for each drug and reaction.
These unique identifiers are shared between drugs and reactions. For example, Preprocessor might map the drugs “Aspirin” to a unique ID of 1521 and “Excedrin” to a unique ID of 141, while mapping the reactions “Headache” and “Nausea” to 35413 and 33899, respectively. This would take a report line from the following format:
"Aspirin","Excedrin" "Headache","Nausea"The line would be output in the following format for consumption by the C++ data mining codebase, which operates using numerical itemsets.
1521 141 35413 33899As shown above, this removes the indication that the drugs and reactions are different objects in the data. This was a particularly poorly documented detail of the process.
The C++ code in the existing MARAS system was used to generate frequent itemsets from the FAERS reports and output association rules that might indicate a causal relationship linking a set of drugs to one or more adverse reactions. The code uses the FP-Growth algorithm for frequent itemset generation.
Through completion of the C++ Deep Dive, many issues were discovered with the existing code. To begin with, there was barely any in-code documentation. This problem was fixed by adding Doxygen-style comments to describe each function and each class. There were also a number of redundant data structures defined in the C++ code that were also defined in the Java code. This problem raised the question of the feasibility of modifying the sections of code written in C++ or Java so that they are both in the same programming language and redundant data structures can be eliminated. Additionally, parameters such as the minimum support and the minimum confidence were both hard-coded constants. While this may work for testing or experimentation purposes, in reality users may want to specify these parameters to customize their results.
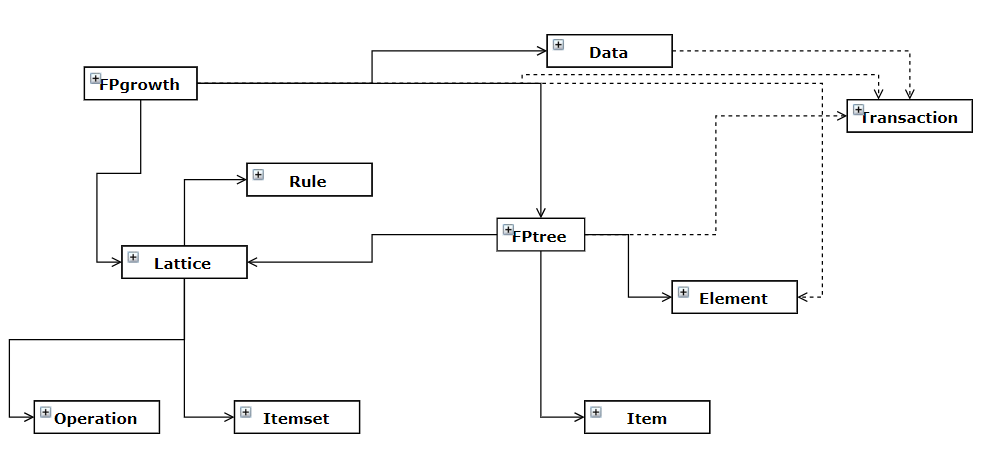
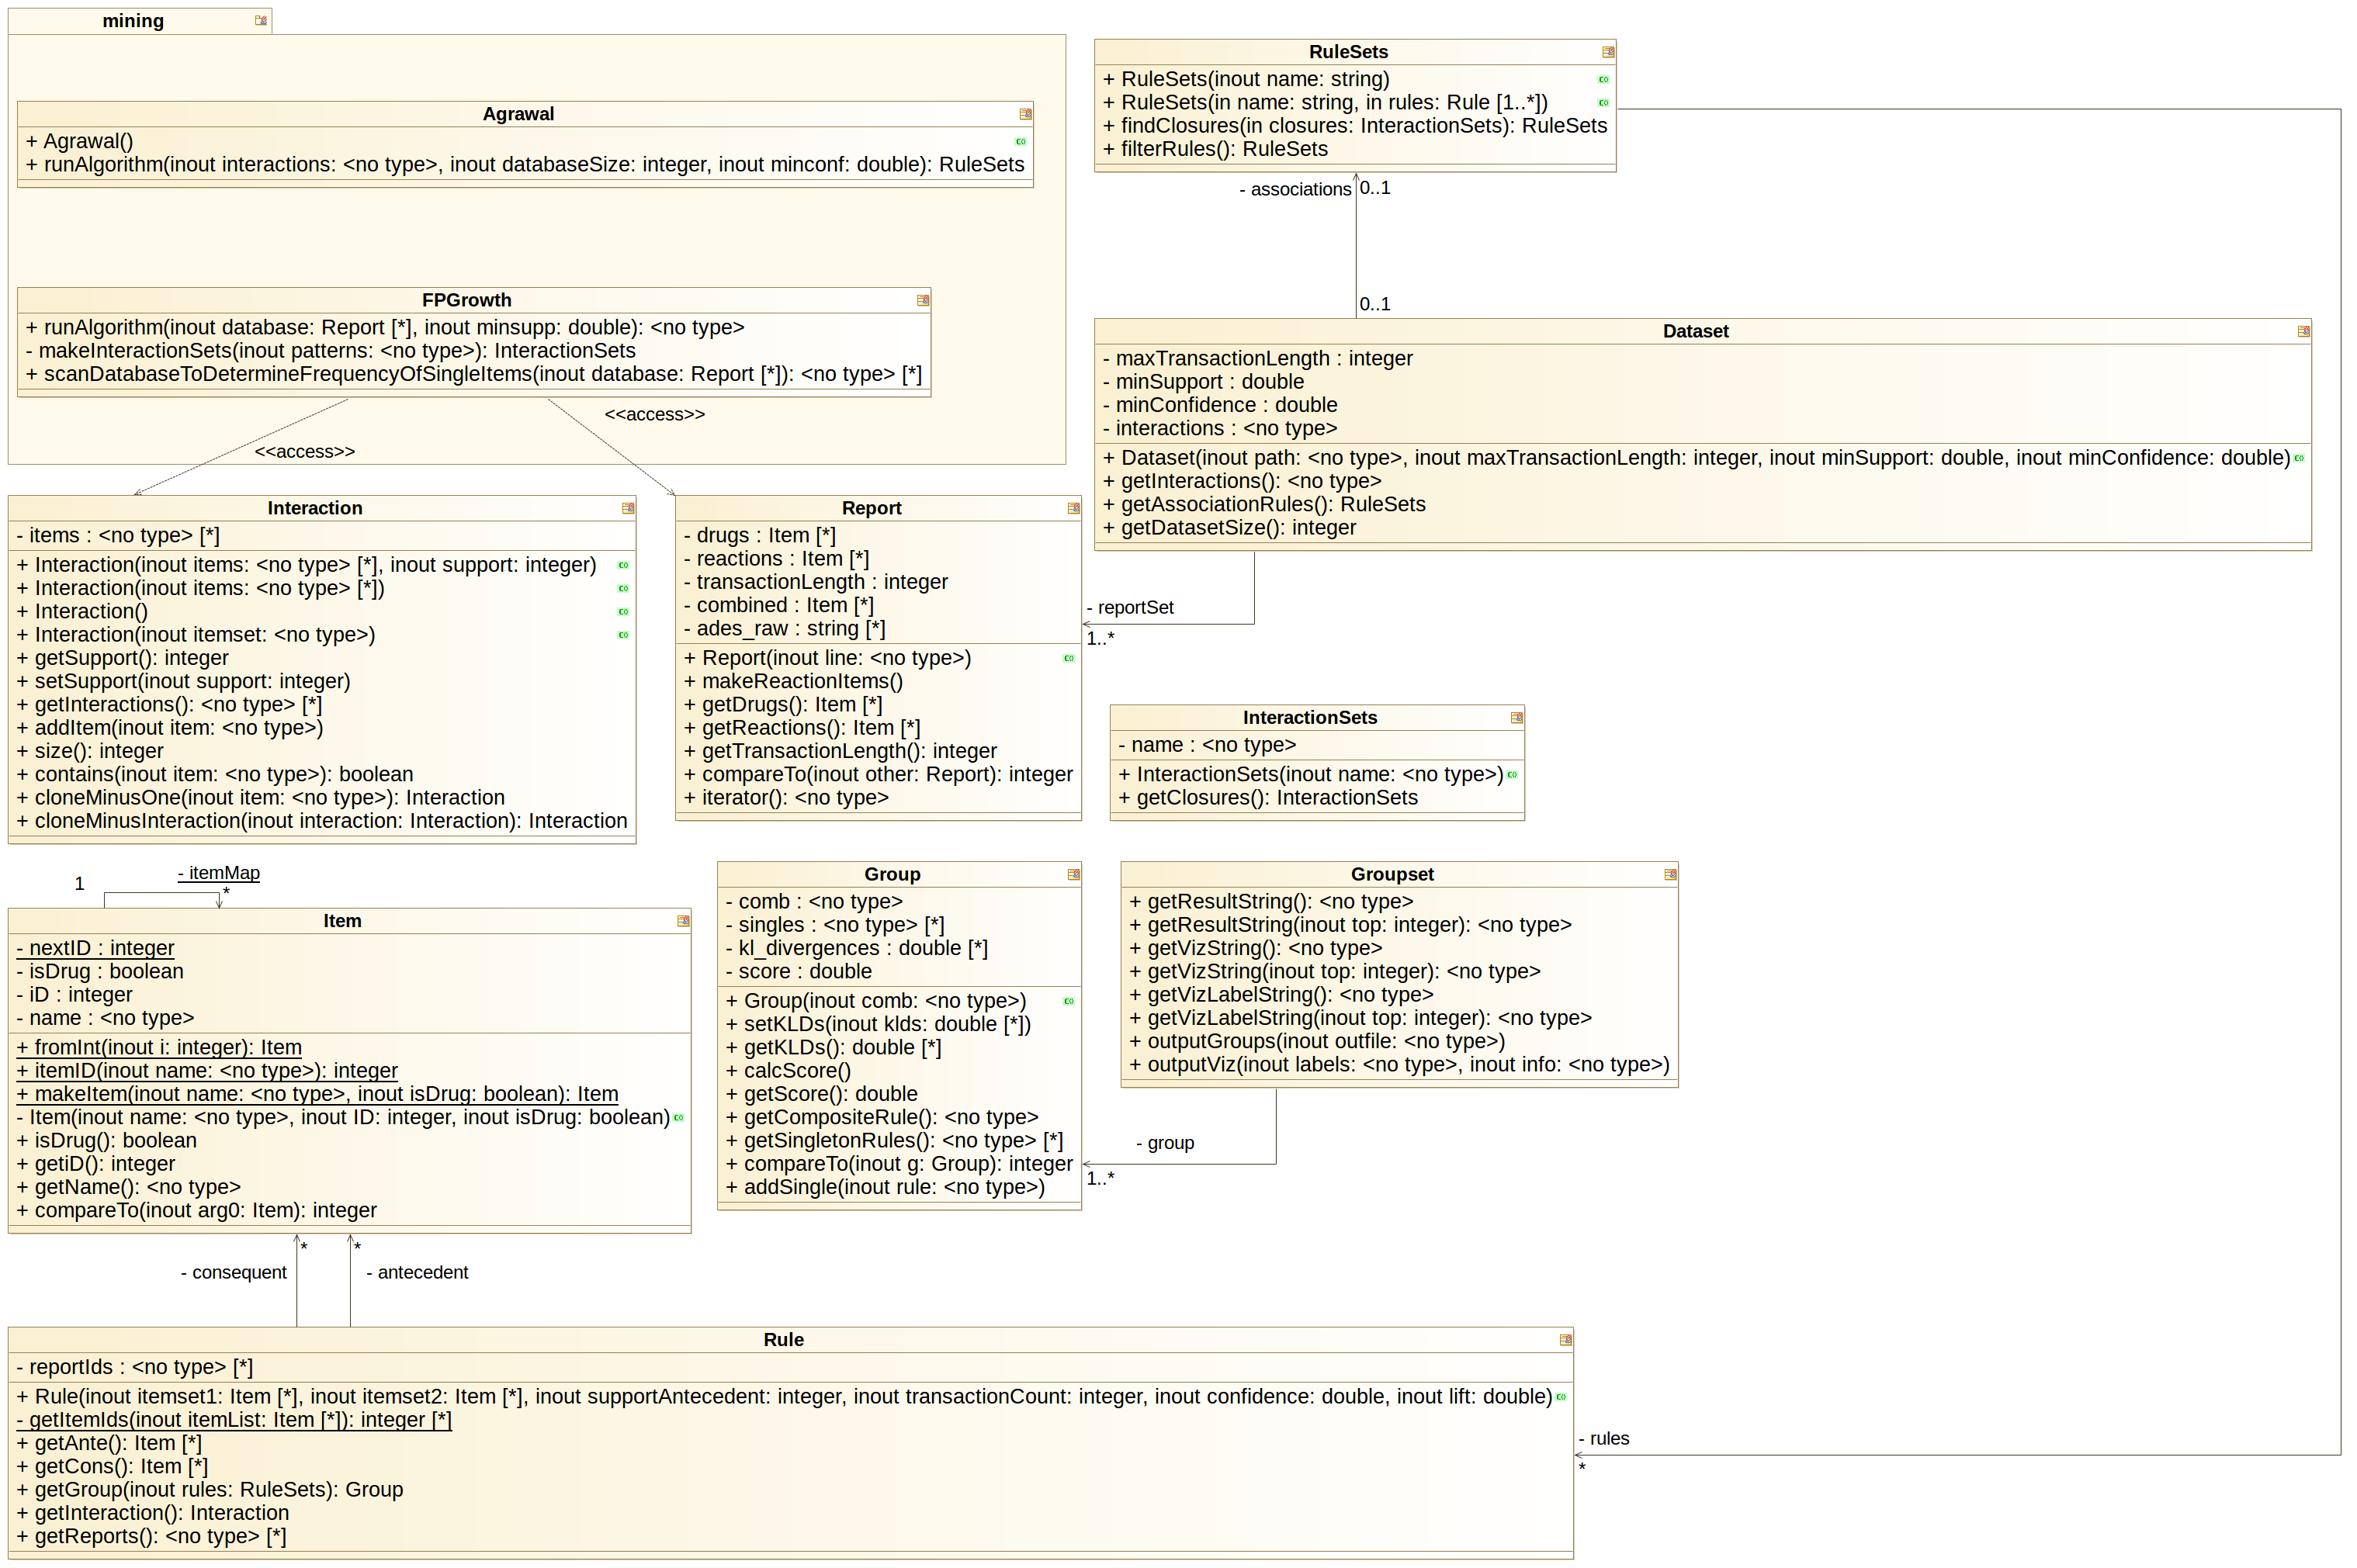
This figure shows the class diagram for the existing C++ code. Upon examination, it is evident that many of the classes represented in C++ are also represented in Java, leading to inevitable redundancies.
The results from the C++ code were used by the ProcessFI section of the JAVA code to populate a list of Itemset objects, where each different itemset length is organized together. It also populated a collection of Rule objects with the rules mine in the C++ code. These Itemsets were then filtered to create closures, using a method defined in ProcessFI and rules were further filtered to only be associated with Closed Itemsets. Additional filtering ensured that no rules originate with reactions.
The ProcessFI executable would output files containing each filtered rule, as well as all the closed itemsets. These files are then read in by the Explorer executable, which creates a Group objects. Each group object associates a closed rule with its component subrules (found from the unfiltered rule-sets). These are used to calculate the score by the process outlined in Sec. 2.1.
The D3 Visualization code produces the DIVA views described in Sec. 2.2. This code takes data produced by the Java rule-mining application and creates the resulting Overview, Galaxy View, Profile View, and Reports View. The Deep-Dive process for this code included the creation of comprehensive documentation using JSDoc, a Doxygen-style documentation system for Javascript code. By using JSDoc-style comments, each function could be annotated to describe its functionality and parameter values. This documentation can output HTML web pages that provide a quick overview of the organizational structure of the software, along with easy access to details on each function. In addition to documentation, the D3 Deep Dive involved changes to the coding style for consistency, including fixes to indentation, spacing and comments.
The SQL code in the MARAS system performs a variety of data manipulation and parsing functions which enable the MARAS system to utilize FAERS report data. First, the SQL code contains functionality to parse FAERS report data from a .txt file format and construct corresponding SQL databases populated from that data. This code collects data on both drugs and reactions and combines them into a single table that contains only the information required by the MARAS system. There are separate functions to handle FAERS data from before 2015 and to handle the data from 2015 and beyond, because the format of the FAERS data changed slightly in 2015.
Second, the code includes functionality to connect rules mined by the MARAS system to the FAERS reports that the rules are generated from; for example, if MARAS discovered a rule stating that taking Advil and Warfarin together caused bleeding, this function would create a list of all of the reports that contained Advil and Warfarin in the drugs and bleeding in the reactions. This behavior is necessary to create the Reports View of the DIVA application.
When examining the SQL code, we considered several refactoring changes that could improve the usability and maintainability of the system as a whole. The codebase contains some functionality that could be accomplished equally effectively in Java, using APIs like JDBC. This would allow us to further centralize our code by keeping as much functionality in one language, and in one system, as possible.
To run the original MARAS system from start to finish, the user had to manually execute each step of the program. These steps included: pre-processing (Java), data mining (C++), finding closures (Java), and generating results (Java). At the beginning and end of each of these steps, the program would read from or write to disk in order to allow the program to pick up from where it left off in the previous step. This combination of excessive file I/O and an unnecessary reliance on user intervention made running the system unnecessarily complicated.
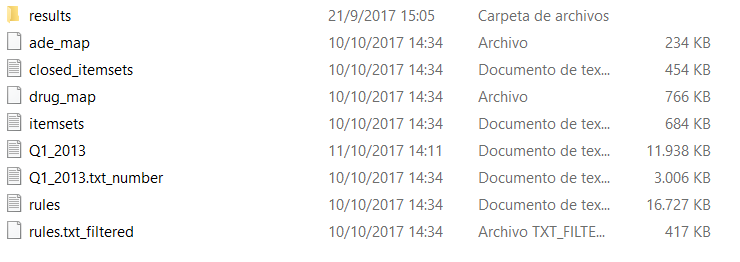
This figure shows all of the files that are created to use during intermediate steps between the initial input and result generation. Following the program execution, these files are largely of no use to the user, other than possibly for debugging purposes.
Following the Java and C++ Deep Dives, the team discussed options for going forward. It was clear from the Deep Dives that the MARAS program should be modified to operate entirely in memory as a one-step process. This would make running the MARAS much simpler and make the process of integrating the MARAS system into the client-server architecture easier in the future.
Another major decision was whether or not to translate the C++ code into Java. In the end, the benefits of having all the code in one language outweighed the costs of rewriting that section of the MARAS system. This decision would make future maintenance of the system a much easier task, allow for the elimination of redundant data structures, and allow for a more natural one-step program flow that did not rely on file I/O to go between intermediate steps.
For the first iteration of refactoring the Java code, we decided to keep the underlying structure of the code as consistent as possible with the previous version while making modifications so that it ran entirely in memory. By minimizing the scale of the changes being made, we hoped to quickly produce a functioning prototype of the MARAS system that could be run on the server. Also in this revision of the code, we found and integrated Java implementations of the FP-Growth algorithm for frequent itemset generation and an association rule mining algorithm. The Java implementations of these algorithms were part of the SPMF Library put together by Philippe Fournier-Viger (Fournier-Viger et al. 2014).
After successfully refactoring three of the original four parts of the MARAS system to execute only in memory, it became apparent that the current program structure was insufficient. For one thing, the program did not take advantage of Java’s object-oriented design principles, lacking much encapsulation. Instead, the existing code relied on frequent parsing of input files into objects, with most of the code operating on that object living outside of the object’s class. Therefore, to improve the program’s logical flow and make it more maintainable in the future, the team decided to refactor the MARAS system from the ground up, embracing the object-oriented design style to make the program flow more meaningful and readable.
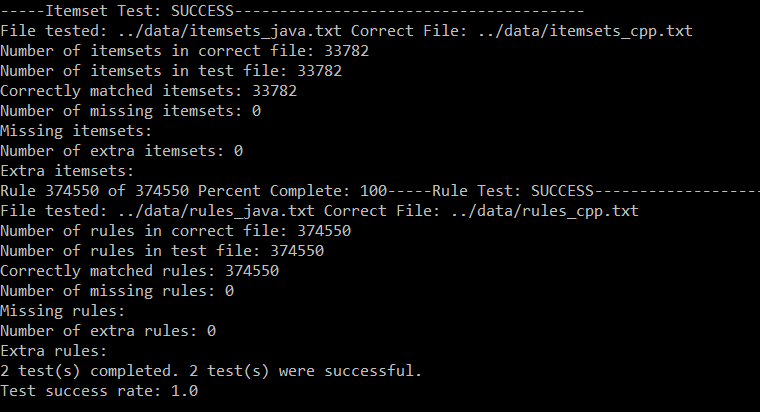
Since we used new implementations of the algorithms for frequent itemset generation and association rule mining, we tested to ensure that both frequent itemset generation algorithms produced the same results given the same input and parameters and likewise for the association rule mining algorithms. To perform the test, both frequent itemset generation implementations were given the same transaction database as input and their minimum supports were both set to 10. Then, an output file was generated by both algorithms. These files were compared to test that they contained the same itemsets, regardless of itemset order or the order of items within the itemset. Similarly, the association rule mining implementations were both given the same set of frequent itemsets, a minimum support of 10, and a minimum confidence of 0. After receiving output files from both algorithms, they were compared to ensure that each algorithm produced the same rules with the same supports and confidence levels, disregarding the location of rules within the file or items within the antecedent or consequent of a rule. As a result of this testing, the team confirmed that both algorithms produced equivalent results, indicating that the Java implementations had been successfully integrated into the program.
For the second Java refactor, the team split the work into four distinct sections to reduce the time taken to perform the refactoring. The main idea of this refactor was to preserve encapsulation wherever possible, meaning that much of the existing code could be reused, but was moved within the class that it manipulated. Therefore, a set of rules could find its closure or filter out invalid rules, rather than performing these functions externally. The result of this refactor was a much simpler, more readable program flow. It was obvious which objects were involved in each step and what actions were being performed because the objects involved in the program’s execution are well labelled and methods with descriptive names are called on the objects to perform any action.
Our team’s overall goal of the Client-Server setup process was to:
We chose NodeJS as the runtime environment and ExpressJS as our main back-end framework. There were two main reasons we used NodeJS. First, NodeJS uses Javascript as its main programming language. Therefore, by using NodeJS, we only had to program in one language across the front-end and back-end. Second, NodeJS is supported and backed by very active open-source community. Hundreds of thousands of packages and modules developed by the community are being hosted on NPM, the main package and dependency manager for NodeJS. ExpressJS is the most popular web micro-framework in the NodeJS community. It is fast, small and does not do much by itself. However, we could pull a lot of open-source modules in an Express application to make it useful and functional. Using NodeJS and ExpressJS as the foundation of the server fulfills the system’s second goal. It is easy to build and start NodeJS server by running a few commands and setting environment variables.
We used TypeScript, an extension of Javascript as our main programming language of the server. It is completely backward compatible with JavaScript but provides nice object-oriented features such as classes and interfaces, and optional static type. The main benefit of using TypeScript is that it enables different Integrated Development Environments (IDEs) to provide extra features such as autocompletion, errors checking, refactoring. Using TypeScript allowed us to divide parts of the project into reusable and maintainable modules, which achieved the third and fourth goals as the project grew.
We used Mocha and Chai as the main testing framework and assertion library. They are the most popular testing stack in NodeJS community and proved to work well together. By writing tests and doing Test Driven Development (TDD), we were confident that every feature worked as we expected and not worried that refactoring or adding new features would break the code somewhere else. This fulfills the reliability goal of the system.
The server for this project served as a resource server for the client application. It provided different endpoints that allowed the client application to do basic REST operations such as reading, creating, updating and deleting on different resources. In order to do this, the ExpressJS server routing and middleware systems provided a set of API to handle the client’s HTTP requests. In this project, requests to read or retrieve the data were important because this allowed the client to get the data, analyze and visualize the information to the end users. For example, the client application could send a GET request to /drugs/ to retrieve all records or /drugs/{drugname} to get all the records related to that specific drug.
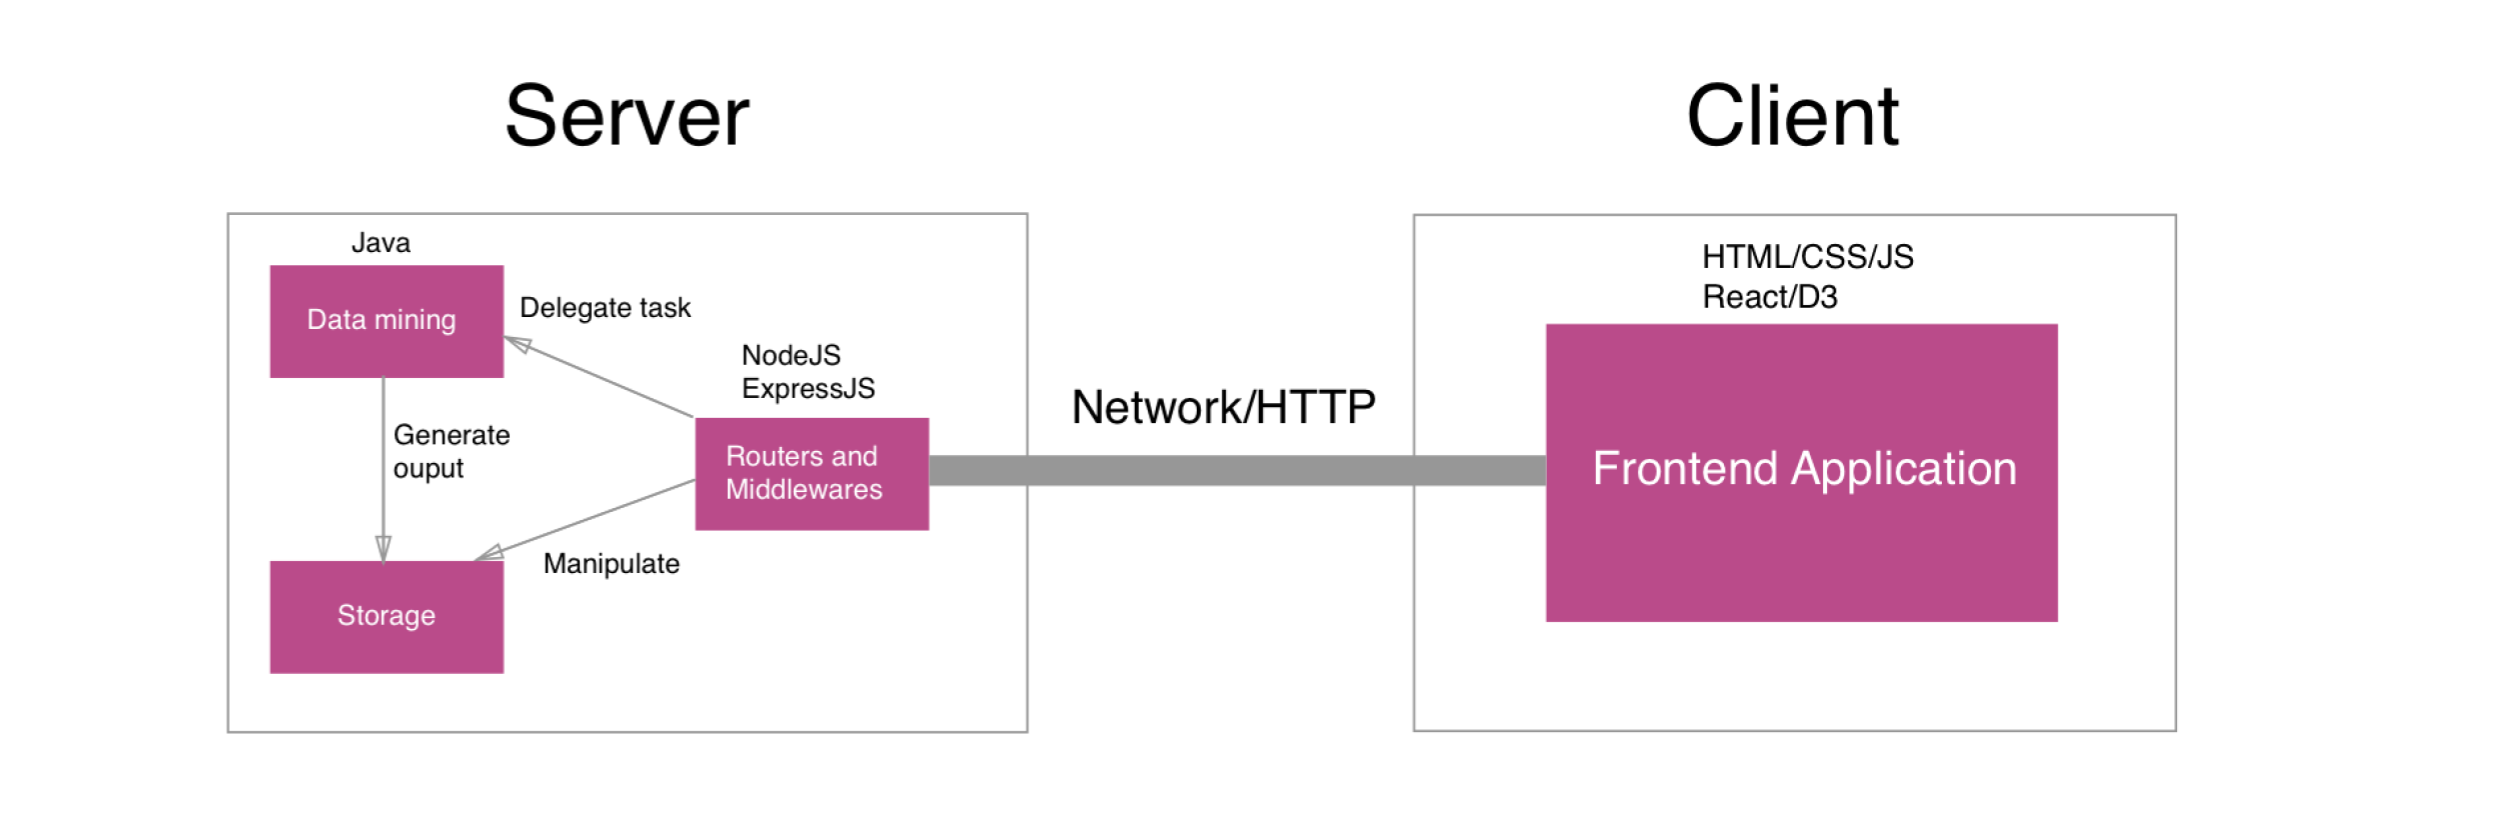
The Java data mining program was a submodule and ran in the NodeJS web server. Whenever the authorized user posts a new data file to the server, the server will process the input file with Java program and generate new output files for data visualization. The server also had a command-line interface to import the data files and run the Java program manually.
The Client-side stack fulfills the first and the most important goal of this project. We used ReactJS as the main front-end framework for building the interface of the application. It allowed us to build different components that we can reuse, which have their own HTML templates, behaviors and states. The components can be put together and interact with other components by sharing the state to make an interactive and native-app-like website.
As mentioned above, one main advantage of using a modern Front-end framework like React is the ability to use third-party components and reuse components that we create. For the layouts and styling of the website, we exclusively used React components implementing Google’s Material Design. By using these components, we can easily create a basic layout containing the navigation bar, sidebar, different panes, text fields, buttons and so on. These components have default style rules, but we are free to override them. We can also attach event listeners to the components to make them interactive. Utilizing third-party components helps us focus more on the logic and behavior than on the styling and animation of the website while still keeping the application aesthetic.
Redux is a small state-management library that works well with React applications. It has a single store that stores all the current states of the applications. The idea behind Redux is simple: a React component (or any other kinds of component) emits a Redux action, which is a Javascript object that describes what happened. When receiving the action, the store singleton will decide how to change the state tree based on the reducers that you implement. Then, any components in the application that subscribe to the state change in the store will re-render themselves to reflect the change to the user. Fig. 11 briefly shows how React and Redux work together. Redux helps the application behave consistently and avoid bugs. It also makes the application scalable because when the application grows bigger and more states need to be controlled and shared among many components, Redux can manage all those states perfectly by creating more actions and reducers.

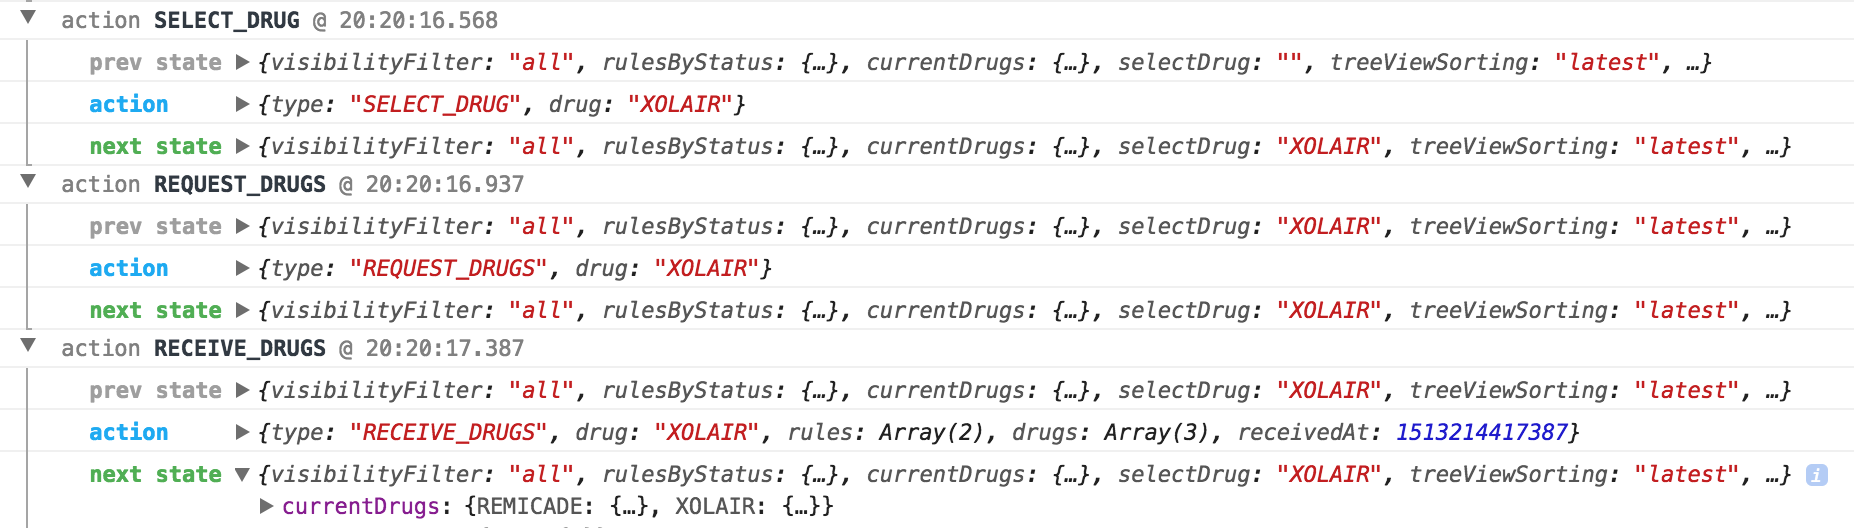
In the new DIVA application, Redux state management connects different components and their states. In Fig. 12, the Redux logging system shows different actions emitted by React components when the user clicks on a node in the Overview view. The store updates its state’s property “selectDrug” to the selected node’s drug name. It also requests the rules related to that drug from the server by the REQUEST_DRUGS action. When the RECEIVE_DRUGS action is emitted with the payload fetched from the server, the store updates its state’s property currentDrugs by adding new drug rules related to that drug. The Galaxy View and Profile View, both of which subscribe to the state changes, will re-render themselves. The Galaxy View listens to the changes in the currentDrugs property in the state tree and renders a new graph corresponding to the recently added drug rules. When the Profile View sees changes to the selectDrug property, it will re-render and show the profile for the new drug. Redux also makes it easy to implement global filters and searching, simply by adding the filter states to the store. Those filters can be applied to all components that subscribe to the Redux store. Figs. 13, 14 shows actions related to updating the filter state.


After refactoring the existing MARAS code and DIVA visualization and creating our initial version of MIAP, it was time to begin adding in new features to meet the needs of a more complete integration of the two sides of the application.
We focused on four areas:
Once the Java and C++ code of MARAS was successfully combined, we next worked on refactoring the SQL code that organizes and filters the raw FAERS data to get specifically the data that the MARAS system will use. Just as with the C++ code, we determined that it would be most effective to replicate the SQL code’s functionality in Java; this would allow us to keep all of the MARAS code in one language, and all of the functionality would be contained in a single executable.
The process of parsing FAERS data evolved through multiple phases. First, the Java program was modified to take 3 file paths as input, corresponding to the three FAERS files MARAS uses: the drugs file (e.g. DRUG17Q2.txt), the reactions file (e.g. REAC17Q2.txt), and the demographics file (e.g. DEMO17Q2.txt). The program parses these three files to compile the data into Report objects, consisting of a list of drugs and a list of reactions; these reports are used by the Association Rule Mining algorithm to calculate the resulting rules.
The FAERS files are structured such that each line refers to a data point for a given FAERS report. For the drugs file, each line contains the ID of the report, the name of the drug, and additional information not used by the MARAS system, such as the dosage. If a given FAERS report contained 5 drugs, the resulting drug file would contain 5 lines, each representing one of those drugs and referring to the same report ID. Similarly, each line of the reactions file contains the ID of the report and the reaction experienced, and each line of the demographics file contains the ID of the report and a set of demographic information about that report. The MARAS system specifically examines expedited reports, which are distinguished in the demographic file as “EXP”.
To handle this data, the MARAS system must search through each of these files and match the lines according to their Report IDs. The result is a list of drugs, reactions, and demographic information that make up a complete report. From there, the system can filter out reports that are not expedited, and create Report objects from the drugs and reactions that can be used by the Association Rule Mining code.
After this change was implemented, we determined that it would be easier if the program directly uses the FAERS data as it is downloaded from the FDA’s website: a .zip file containing a number of different files and folders, beyond just the three that the MARAS system uses. We refactored the input to now take in a single .zip file; it then extracts the files from this zipped folder and searches for the three relevant files, then runs the analysis on those files as before. This makes the command-line arguments for the file simpler, and reduces the amount of work that must be completed before running the MARAS code.
While this functionality was effective for mining rules from a single set of FAERS data files, which are organized by year and quarter (such as 2017 Q2), it did not allow us to find rules from the combination of multiple sets of FAERS data. Therefore, the next step in refactoring would be to support cumulatively analyzing sets of FAERS data in conjunction with the data already used. In order to accomplish this, the MARAS program saves the three FAERS files extracted from the zipped folder in a data directory, then parses all of the files in that directory into the Report objects. Therefore, when the user passes a zipped FAERS folder to the MARAS system, the data is added from that folder to the collection of data it has already been given, and then generates the ruleset with this new data included. This allows the system to generate rules based on any number of FAERS datasets collectively, as opposed to a single FAERS dataset at a time.
This setup successfully meets the goal of allowing the MARAS system to utilize multiple sets of data from FAERS, but it had a significant problem: repeatedly parsing the files is inefficient, and as more and more datasets are added the system took exponentially long to run. Indeed, even running the system on just two datasets, the 2013 Q1 and the 2017 Q2 data, took well over an hour to complete. Therefore it was important to find any way we could speed up this process; namely, by reducing the repeated work done each time the system ran.
The clearest candidate of repeated work that could be eliminated is the process of parsing the raw FAERS text files. Each raw file contains a significant amount of data, much of which is ignored by the MARAS system. This resulted in a significant time cost that could be avoided by cutting out as much unnecessary data as possible. We determined the most effective method for this would be to store the parsed data in a new format after organizing the information into a set of Reports; when the system runs, rather than parsing the raw data over again, it will parse the new format that contains just the information it needs. The format we used is a text file where each line represents a report; each line contains a list of drug names and reaction names, with an arrow symbol “->” in between to distinguish them. Additionally, each drug or reaction name is separated by a comma. This results in concise data that only stores the information needed by the system. This dramatically reduced the size of the data being parsed; while the raw FAERS files for 2017 Q2 combined were almost 200 MB of data, the simplified file for that same data was just 16.5 MB. The results were also clear in terms of the time the system took; whereas running the system on the 2013 Q1 and 2017 Q2 data took over an hour before the change, after the change it took around 12 minutes from start to finish.
Next, there were several steps that made the MARAS system more efficient and simpler to use. First, the command line argument format was refactored to emphasize simplicity and flexibility. While the first version of the MARAS system simply defined command line arguments based on the order of the arguments (the first argument was the FAERS file, the second argument was the output path, etc.), the new version used specific flags to indicate which argument was which, such as “-f” to indicate the FAERS file(s) used and “-o” to indicate the output path. This meant the user would not have to memorize the order of the arguments, and also allowed for more flexibility for certain parameters. For example, under this format the MARAS system supports the input of multiple FAERS files at a time, which provides greater flexibility.
One important component of the DIVA/MARAS system is the ability to label potential drug-drug interactions that are mined from FAERS data as known or unknown. A drug-drug interaction is labeled as known if the interaction has been previously documented. Otherwise the rule is labeled as unknown. This labeling process is important because it allows FDA analysts to filter out interactions in the DIVA visualization that correspond to known drug-drug interactions so that they can instead focus on discovering novel ADRs.
After researching sources of known drug-drug interactions, the team considered two potential sources: Twosides and a RESTful API that draws information from the ONCHigh and Drugbank databases (Tatonetti et al. (2012), (“Drug Interactions API” 2017)). Twosides is a database available as a file download that contains simple known drug-drug interaction rules, each rule consisting of two drugs and one adverse reaction. Meanwhile, the RESTful API takes as input the name of a drug and provides information about any known interactions with other drugs. However, the problem with the reaction information obtained via the RESTful API is that it provides a general description of the ADR, rather than a descriptive term such as those found in the FAERS reports and the MARAS rules. For example, for the reaction between Vincristine and Cyclophosphamide the RESTful API describes the ADR as “The serum concentration of Vincristine can be increased when it is combined with Cyclophosphamide”, whereas corresponding Twosides and MARAS rules label the ADR as Anemia. Therefore, the RESTful API could not easily be used to decide whether a given MARAS rule is known or unknown due to this difference in the method of describing ADRs. For this reason, the team chose to use the Twosides database for the purpose of identifying known drug- drug interactions.
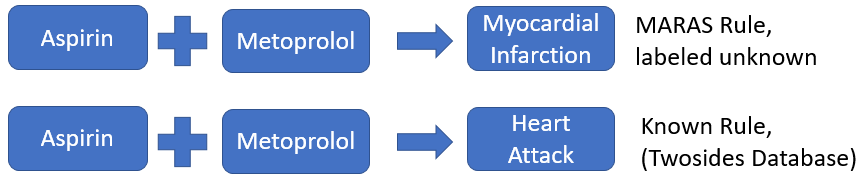
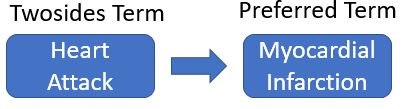
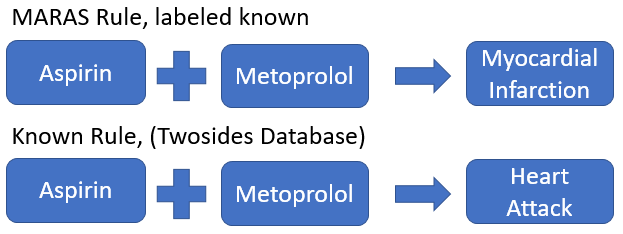
After finding this source for known drug-drug interactions, there were still problems with matching the drug-drug interaction rules found in the MARAS system with the known rules from the Twosides database. The main issue was that the names of ADRs in the Twosides database did not always match up with the names of ADRs used by the FDA in the FAERS data. This meant that there were rules mined by the MARAS system that were equivalent to rules found in the Twosides database of known drug-drug interactions but were not matched because the term used to describe the MARAS rule’s ADR was a synonym for the term used to describe the Twosides rule’s ADR. Consider the following example. The MARAS system mines the rule that states that Aspirin, when used in conjunction with Metoprolol, causes Myocardial Infarction. Meanwhile, a similar rule in the Twosides database states that Aspirin, when used in conjunction with Metoprolol, causes Heart Attack. While these two rules are equivalent in meaning, the MARAS system failed to label the MARAS rule as known since the ADR names were different. This problem supported the need for ADR name standardization between the known rules in the Twosides database and the rules mined from the FDA’s FAERS data.
The MedDRA hierarchy is a commonly used form of classifying and grouping related terms for ADRs ((“MedDRA Hierarchy - How to Use” 2017)). The hierarchy is organized from most general to most specific. The levels of the hierarchy are System Organ Class (SOC), High Level Group Term (HLGT), High Level Term (HLT), Preferred Term (PT), and Lowest Level Term (LLT). LLTs are the most specific terms and describe how an observation is usually reported. Each LLT corresponds to only one PT, and each PT corresponds to at least one LLT. In addition, PTs can have synonyms. The next level of abstraction groups similar PTs under a single HLT, which are further abstracted into HLGTs. Lastly, HLGTs are grouped into SOCs by the cause of disease, area affected by the disease, or purpose.
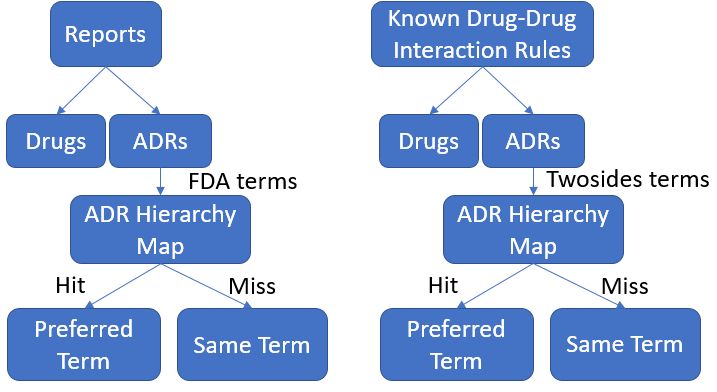
The ADRs given in the FAERS reports are in MedDRA PTs (“Questions and Answers on FDA’s Adverse Event Reporting System (FAERS)” 2017). However, the ADRs in the Twosides database are either in LLT or PT form. Therefore, there is a need to convert all ADRs to PTs and recognize when two or more PTs are synonyms. These are the principal goals of ADR name standardization in this context. However, it should also be noted that the proposed method of ADR standardization will also help to reduce the number of MARAS ADRs that are synonyms for one another, resulting in rules with higher support values that more accurately reflect the importance of the drug-drug interaction.
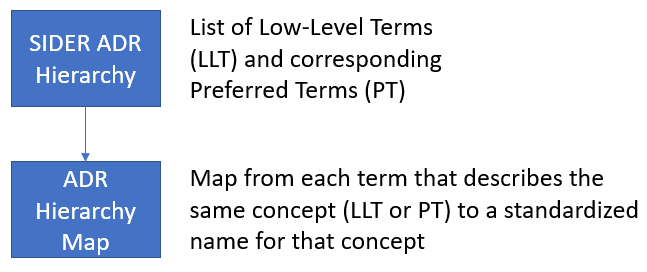
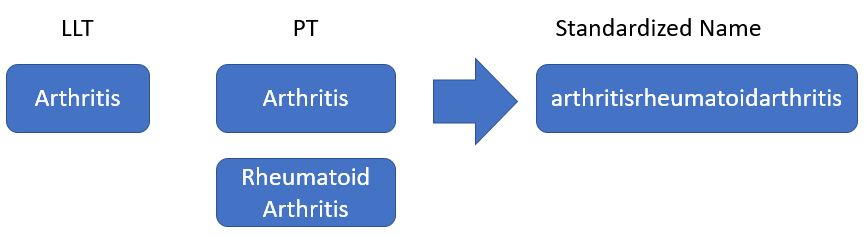
When researching methods of ADR name standardization, the team first discovered the SIDER database, which contains mappings from LLTs to PTs that are extracted from drug labels Kuhn et al. (2016). To leverage this database for name standardization, each mapping was read in, using the process seen in fig. 15, to attempt to create ADR schemas corresponding to each distinct ADR. Each ADR schema has at least one LLT, at least one PT, and a standardized name (made up of the concatenation of all PTs in alphabetical order). An example of such an ADR schema can be seen in fig. 16. Then, when an ADR term was read in, either from the FAERS data or the known rules, the term was checked against each ADR schema to see if it matched any of the LLTs or PTs of that ADR. If a match was found, then, as in fig. 17, the ADR term was changed to the standardized name from that ADR schema to be used in the subsequent steps of the MARAS system.
While the number of rules labeled as known by the MARAS system increased, the system still failed to recognize that Heart Attack is the same ADR as Myocardial Infarction (Fig. 18), signifying that the SIDER database was incomplete in its mapping database from LLTs to PTs. Therefore, an alternative source of ADR name standardization, MetaMap, was explored.
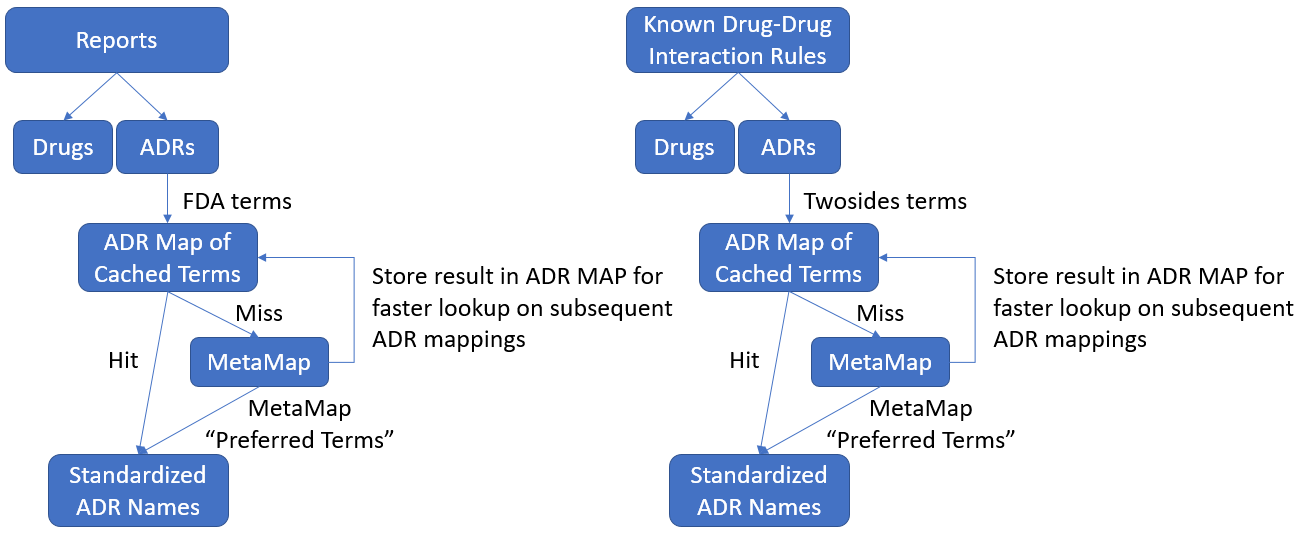
MetaMap is a tool provided by the National Library of Medicine that parses natural language and identifies Unified Medical Language System concepts from the text (Aronson and Lang (2010), (“Unified Medical Language System (UMLS)” 2017)). To implement MetaMap into the MARAS system, every time an ADR term was read in from the FAERS data or the known rules, the term was checked against a “cached” map of all ADR name conversions that were previously made by MetaMap. This process can be seen in fig. 19. In the event that the ADR term had not previously been converted with MetaMap, the term was submitted to MetaMap and the resulting PTs were concatenated to form a single standardized term for the ADR. This standardized term was then added to the map of “cached” terms to reduce future look-up times. An example of a mapping using MetaMap can be seen in fig. 20.
After implementing both methods of ADR name standardization, a comparison, seen in fig. 21, was done on the effect of each method on the MARAS process. Using the SIDER ADR hierarchy, the MARAS system detected 7657 distinct ADRs, whereas 7724 distinct ADRs were detected when using MetaMap. This may mean that the MetaMap system does not generalize as well as the SIDER ADR hierarchy. Despite appearing to exhibit less generalization, MetaMap outperformed SIDER at matching MARAS rules with equivalent known rules, finding 56 known rules out of 1542 while the SIDER-based system found only 13. In addition, the set of 13 rules labeled known by the SIDER-based system was a subset of the 56 rules found by the MetaMap-based system. It is also worth noting that the MetaMap-based system succeeded in recognizing that Heart Attack is a synonym for Myocardial Infarction, resulting in more rules being labeled as known, such as the rule in fig. 21. As another part of the comparison, the time was measured during the process of standardizing the ADR terms for each of the known rules using both methods. A further experiment was conducted to measure the time taken to process the rules with and without parallelization for each method. Without parallelization, the MetaMap-based method took 38 minutes to process the known rule database while the SIDER-based method took 45 minutes. With parallelization, the MetaMap-based method took 8.3 minutes to process the known rule database while the SIDER-based method took 8.6 minutes. Overall, the team decided that the MetaMap-based approach was a better match for the MARAS system because it not only provided for better known rule matching but also outperformed the SIDER-based approach in terms of time efficiency.
| MetaMap | SIDER ADR Hierarchy | |
|---|---|---|
| # of distinct ADRs | 7724 | 7657 |
| # of rules labeled as Known | 56 | 13 |
| Time to parse known rules | \(\approx8.3\) minutes | \(\approx 8.6\) minutes |
| Time to parse before parallelization | \(\approx38\) minutes | \(\approx45\) minutes |
Once MetaMap was chosen as the engine for adverse reaction mapping, we integrated not just the calls to the Metamap API, but also the operations of the MetaMap server. To successfully utilize the MetaMap API, MARAS uses three separate server instances: the SKR/Medpost Tagger, the Word Sense Disambiguation (WSD) Server, and finally the actual MetaMap server itself. Originally, this required manually starting these three separate server instances in different windows or as background processes, and then manually closing these instances when they are no longer needed. To improve simplicity and usability, this process was instead integrated as part of the MARAS system itself. The program starts the three separate server instances on its own, and closes them once the analysis is completed. This reduces the overhead required by the user to start the system, and makes the MARAS-DIVA integration simpler.
Finally, the MARAS system had to be deployed to our server, set up through WPI. Because the server is run through a Linux system, and our testing up to this point was performed on Windows systems, the first step required to integrate to the server was to handle Linux support. This primarily involved refactoring to properly support the Linux version of MetaMap; the MARAS system will detect which operating system is being used and launch the proper MetaMap instances appropriately.
When parsing the input data in order begin preprocessing it for mining in our MARAS tool, we found that we had many similar drug names in our input fields, where a human would often be able to recognize as belonging to the same drug. However, in these situations the association-rule mining algorithms would end up treating them as different drugs, as their names wouldn’t pass naïve equality checks. In order to accomplish this, our algorithms must consider a ‘fuzzy’ notion of equality.
This notion is often used in name lookups for people—as it is easy to misspell someone’s name, especially in international settings. In their master’s thesis, Du (2005), explored the effectiveness of various algorithms for matching similar personal names. They found that for language independent name matching, algorithms based on edit distance. gave the most effective results.
Less formally, edit distance is the number of simple edits required to transform one string into another. The different operation classified as simple edits are the substitution of a letter, deletion of a letter, insertion of a letter, and the transposition of two adjacent letters (Du (2005) pp. 5).
The smaller the edit distance between two strings, the more similar each string is to the other.
When using edit distance algorithms to correct misspellings of surnames across multiple cultures, Du (2005) found that there was a tradeoff between speed and maximizing the number of relevant matches. They found that using a Bloom Filter and reverse edit distance would minimize the number of irrelevant matches while running faster, while using edit distance with a trie data structure and constant first letter would maximize the number of relevant matches at the expense of speed.
This sounds like it would work pretty well for our usage. While we are unlikely to encounter misspellings, the data we get from FAERS can often contain extra information, like the active ingredient in addition to the name, the dosage information, or even just a repeat of the drug names themselves.
However, in order to have anything to match, we need to have a database of normalized drug names—a set of drugs that we match everything back to. The main difficulty here is developing a vocabulary of drugs that is sufficiently large and will almost always contain the drug that was meant in the report. For this purpose, we are using RxNorm, a dataset of all perscribable drugs managed by the National Library of Medicine (Liu et al. (2005)).
In order for accurate sorting of the imperfect names in the ADR reports we need to have a dataset that includes almost all named drugs without having too many overlapping names. Unfortunately, with RxNorm there were many overlapping names in even the smallest dataset provided, as the dataset provides some mapping functionality between different formats for each drug.
Thus, we had to further clean the dataset in order to make full use of it for drug name matching. For the first iteration of dataset cleaning, we used a script to create a JSON datafile that contained only drug names that didn’t have another dataset entry with a name that was a substring of it’s name.
For example, if there was injectablediazepam as well as diazepam, we’d only want to include diazepam. To accomplish this the following python loop was executed for every new drug name read into the script.
Listing 10: Naive Vocabulary Building
flag = True
for drug_id in output_dict.keys():
    drug = output_dict[drug_id]
    if name in drug:
        flag = False
        break;
    if drug in name:
        output_dict.pop(drug_id)
if flag:
    output_dict[nId] = name
This is just a naive check to see if our dictionary of drugs (and id’s) either contains another drug whose name is fully contained within the current drug’s name—which means we ignore this new drug—or if drugs we already added to the dictionary fully contain the current drug name, whereupon we remove those drugs from the dictionary and keep checking more drugs.
Of course, this makes parsing the dataset a very computationally expensive process, being \(O(n^2)\) and having to process more than 200,000 lines. In initial testing, this takes almost an hour. Fortunately, once the dataset is satisfactorily cleaned, the drug list will not have to be recalculated for quite a while.
Unfortunately, this didn’t do quite enough to remove redundancies in the dataset. This algorithm left overly-specific entries such as the following:
Listing 11: Vocabulary Sample Showing Redundancy from Dosage Information
1003676: 'zerit15mgoralcapsule',
1003680: 'zerit20mgoralcapsule',
1003684: 'zerit30mgoralcapsule',
1003688: 'zerit40mgoralcapsule'
A human user would reduce such drugs to 'zerit', leaving off the dosage information, but since there wasn’t necessarily an entry in the dataset merely saying 'zerit', the entries were never shortened.
Thus, we worked on creating a dictionary of strings that could be (mostly) safely ignored when parsing the drug names. This included words like oral, and injectable, but also numbers, units, or body part descriptors such as vaginal, subcutaneous. Because we aggressively removed matching character sequences from our potential drug names, we had to be sure that the patterns we were using wouldn’t match unintended words. For example, without special treatment, the pattern in would match the final two characters in the word protein, which was undesirable. Thus, we made the pattern ' in ', which would only match with whole words.
Additionally, drugs would often be of the form:
Listing 12: Vocabulary Sample Showing Redundancy from Alternate Forms
3858048: 'd4t30mgoralcapsule[zerit]',
3858049: 'dht30mgoralcapsule[zerit]',
3858259: 'd4t20mgoralcapsule[zerit]',
3858260: 'dht20mgoralcapsule[zerit]'
This is an easy special case, since we can just find the string inside the square brackets and reduce our result to zerit, which is our goal.
Once we developed this vocabulary, we can run the edit distance on all members of the vocabulary for a matchable drug name. Consider the following example vocabulary:
vicodinzamicetibuprofentheophyllineIf we are attempting to match IBUPROFEN 500mg, then the process would be to first perform the same normalization step as we did with the strings in the dataset: removing whitespace and converting to lowercase. Thus, IBUPROFEN 500mg becomes ibuprofen500mg. Then we calculate the edit distance for each of the strings in our vocabulary.
At first, we considered pure Levenschtein Distance, which is an edit distance involving only the substitution, insertion or deletion of single letters. We modified the cost of substitution to be the same as an insertion followed by a deletion, otherwise all words of the same length and no overlapping letters would be just as far away as a word that contains every letter in the source string, but is twice as long.
The algorithm we used to test this distance was implemented in JAVA by Lloyd (1999), for example if we run ibuprofen500mg, we get edit distances of:
ibuprofen500mg -> vicodin: 15ibuprofen500mg -> zamicet: 17ibuprofen500mg -> ibuprofen: 5ibuprofen500mg -> theophylline: 22We also considered a second distance metric: Damerau-Levenschtein distance, which adds the ability to swap adjacent characters. This operation needs to have a cost of at least half the sum of the costs of addition and deletion for the algorithm we found, implemented by Kevin Stern in 2014. We chose a cost of 1.2 as an initial test. For this metric, we get edit distances of:
ibuprofen500mg -> vicodin: 15ibuprofen500mg -> zamicet: 17ibuprofen500mg -> ibuprofen: 5ibuprofen500mg -> theophylline: 19.4In our example vocabulary, both algorithms come up with ibuprofen as the best match by far, which is good.
We ran this algorithm on the first 20,000 reports in our data set and tuned Damerau-Levenschtein distance parameters to attempt to maximize the number of distinct drugs mapped. We ended up with approximately 8500 distinct drugs matched in the first 20,000 reports using the following parameters:
Once implemented and tuned, we needed to ensure that the behavior of our matching method was reasonable and did not consistently match unrelated drugs. To this end, we examined a random sample of the matched reports to document:
ibuprofen500mg)ibuprofen)For example, a test sampling of 5 entries gave:
| Mapping Number | Input Name | Matched Name | Edit Distance | Count |
|---|---|---|---|---|
| 35498 | inexium |
nexium |
1.0 | 27 |
| 515084 | carvedilol |
carvedilol |
0.0 | 712 |
| 483937 | metoject |
totect |
3.6 | 87 |
| 322073 | metamucil |
metamucil |
0.0 | 45 |
| 397503 | cyclosporine un |
cyclosporine |
4.0 | 2 |
The sensibility of a specific drug mapping is, however, a very domain-specific problem. It, for example, it doesn’t make much medical sense to map metoject to totect as they are completely different drugs. Metoject is a cytotoxic antimetabolite used to treat severe arthritis, while Totect is a drug used to protect a patient’s heart during chemotherapy for breast cancer.
Alternatively, INexium and Nexium are very close matches and are, in fact, the same drug. So this is a sensible match. For evaluation, we manually examined both sides of the mapping to determine if the match is sensible or not. However, not all sensible (or not sensible) mappings were created equal. It is more valuable that all 712 occurrences of Carvedilol in the reports were mapped correctly than that 45 occurrences of Metamucil were. Thus we weighted the value of each sensible or not sensible mapping based on how often they occurred.
Since we didn’t want exceedingly common mappings like Carvedilol to completely eclipse the more niche mappings we decided to compare the weights of the square roots of the occurrences. This way the most common drugs are only somewhat more important than those that happen just enough to contribute to the rule lists.
In the above table, the four sensible matches (Inexium, Carvedilol, Metamucil, and Clyclosporine) contribute a weight of 40.0 to sensible matching, while Metoject contributes a score of 9.3 to the not sensible matching.
In all this sample gets a score of \(0.811\). Without the square-root weighting, this corresponds to 94% of drug instances being matched sensibly.
For a larger sample, consisting of 100 mapping instances, we got a score of 0.842, corresponding to 86% of drug instances being matched sensibly.
We then tuned the weights of the algorithm to try to maximize the effectiveness of our matching techniques. In the end, after 5 tuning passes, we were able to improve our sensiblility metric to 0.855, which corresponded to 91% of all drug instances being matched sensibly.
We started by improving the design and functionalities of the DIVA website. Like DIVA, the new website has four basic views: Overview, Galaxy View, Profile View and Report View. These views are complicated and contain a lot of logic. Therefore, for better maintainability, we refactored them as a collection of React components which have parent-child relationships instead of one single component. The parent component can pass down the state to its child components as “props” and the child component can modify its parent’s state by emitting some actions. Fig. 22 shows the layout of the website’s main view.
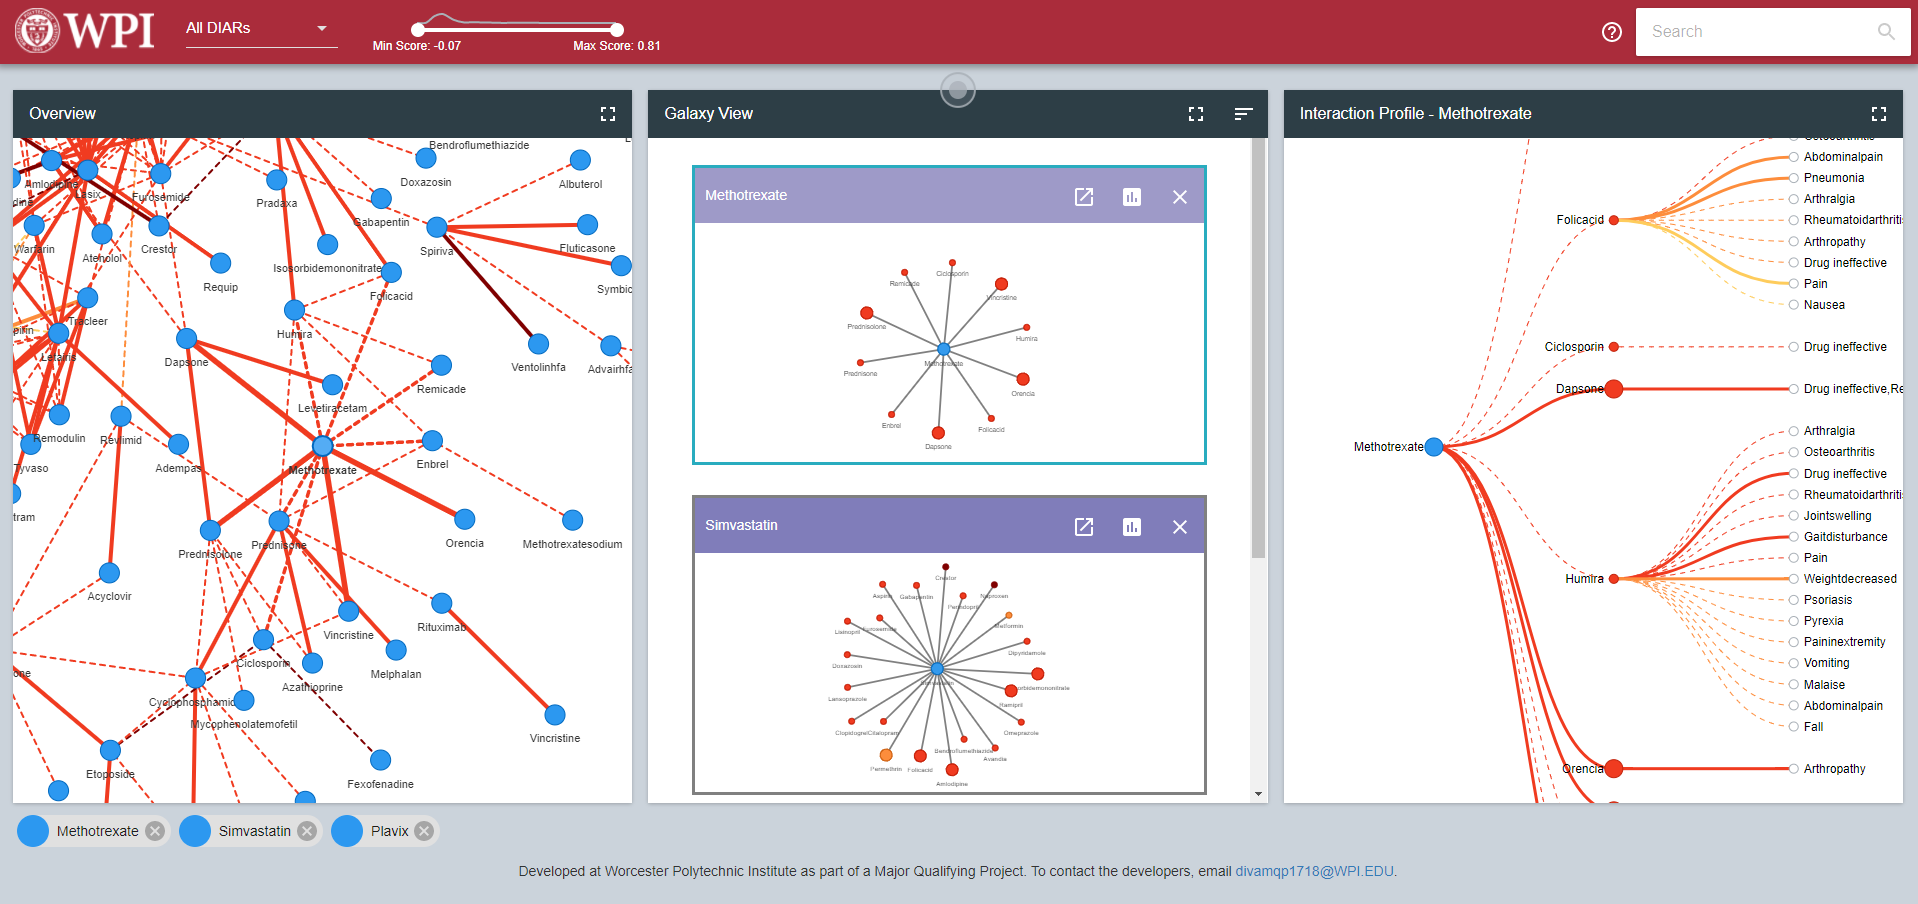
At the initial load of the website, the force-layout graph in the Overview pane on the left is displayed. To render the forced-layout network graph, we use the VisJs library. The library is highly customizable. We can customize anything from colors of nodes and edges to the duration of animation using a global “options” object which is passed to the React graph component. Drugs are displayed as nodes. Meanwhile, an edge represents the rule between two drugs with the highest score of all rules between those two drugs. There are two kinds of edges: the solid lines show rules that are unknown and the dashed lines show rules that are known. The colors of edges represent their contrast scores. Since the scores are not evenly distributed, we used four colors to show four discrete ranges of scores: smaller than 0, smaller than 0.01, smaller than 0.2 and larger than 0.2. In addition, by hovering over an edge, a pop-up appears and shows the information about the rule such as drug names, ADR, report counts, score and status. By hovering over a node, the corresponding drug name appears and all the edges containing that node are highlighted.
The Galaxy View is similar to that of the old DIVA system. Each pane shows the interactions related to one specific drug, which is the blue node at the center of each graph. We implemented various sorting methods for the Galaxy View: sorting by name of drugs, sorting by the latest drugs added to the view, sorting by the number of edges containing that drug and by the number of severe ADRs. Each pane also has the ability to remove the drug from the Galaxy View and show the drug’s profile in Profile View. One difference from the old system is that each pane’s header is now colored to represent the severe ADR count associated with that pane’s drug of interest. Previously, the border was colored to represent this information; however, in the new system a colored border is used to indicate the selected drug, or the drug that is currently being displayed in the Profile view and highlighted in the Overview.
The Profile View and the Report View work as in the old DIVA website.
In addition to these views that existed in the old system, we have added new features to visually enhance the interface and assist users in leveraging the system to identify MDARs.
To begin with, a detailed help section was added. The help section features information about each of the different views, including the significance of different colors and line styles, as well as information about the different filters that can be used on each of the views, and finally an About Us section indicating the team that developed DIVA and how to contact them.
 |
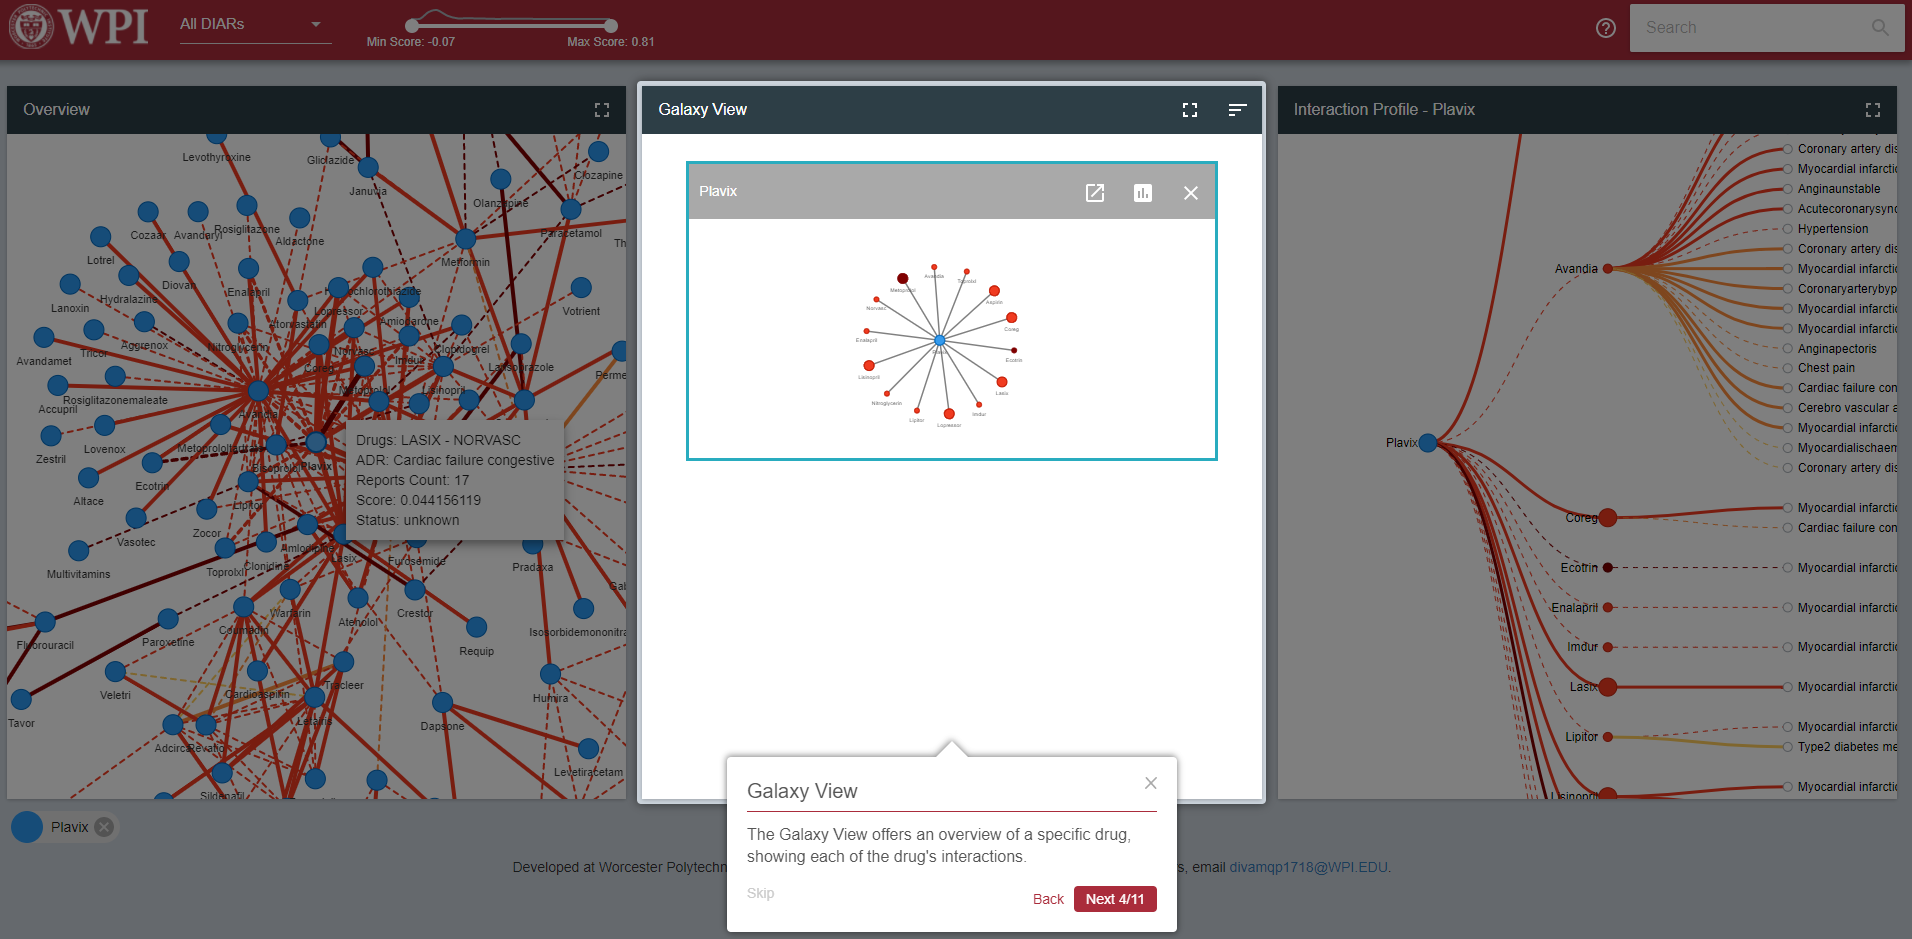 |
Figure 24: Screenshots of Tour. a — Tour Waiting for Action, b — Tour After Interaction
As seen above, the tour asks users to interact with the interface in order to progress on the tour, showing them naturally the functionality of the application.
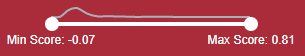
The filter used to indicate minimum and maximum contrast score was improved by allowing for an upper and lower bound rather than a single value. Additionally, a curve above the range slider shows the distribution of contrast scores among all interactions. This information can help users to understand how they are filtering the views and how much information they are filtering out.
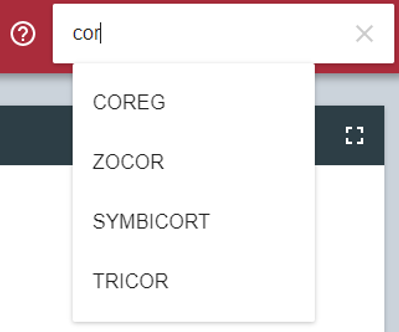
The Search box was also improved significantly. It supports the auto-completetion of drug names so that the users do not need to remember the exact drug name as in the old DIVA system. Once the user clicks or presses enter, all three views will be re-rendered. The Overview window zooms in to the searched drug. The searched drug is also added to the Galaxy View and its profile is shown in the Galaxy. A chip corresponding to the searched drug is also added (see below).
Lastly, a Chip system was added to facilitate viewing reports. Whenever a user clicks on a node or an edge in the Overview tab, a corresponding chip is added to the bottom of the screen. Chips are colored blue if they represent a single drug, or if the chip represents a DDI, then the chip is colored according to that DDI’s link in the Overview. Clicking on the chip will allow the user to view all FAERS reports that correspond to that drug or DDI. Note that to view reports for a drug, the user can also go through the Galaxy View, but to view reports for a DDI, the user must use this chip system.

After completing our integration and improvement steps in creating MIAP, we needed to ensure not only that it would run without bugs, but that it still was capable of providing users with the tools to accomplish all of the tasks that they were able to in the previous iterations of DIVA. This chapter, divided into our technical testing and user evaluation sections, will outline our evaluation processes.
Listing 13: MIAP Technical Requirement 1
Correctly intake, mine, and rank new FAERS data provided by a user with no
further human intervention
This placeholder section will cover the process we use to analyze the correctness and functionality of our backend platform, ensuring it meets standards.
Here we introduce our Usability study by summarizing the function of the study, why we chose to do this particular type of user case study, and discussing alternatives.
Our usability evaluation was focused on determining how well the MIAP application met the requirements from Kakar (2016), discussed in Sec. 2.2. During the development process for MIAP, we decided to skip over Requirement 7, because annotations and note-taking were not part of the state-of-the art research done by our graduate student partners, Kakar and Qin.
Requirements 8 and 9 focused on usability and were general enough for us to consider part of the overall requirement for the project, in that creating an application that is usable is part of following good software engineering practices. Therefore, we omitted those requirements from our final list of requirements for MIAP. Thus, the six following requirements, adapted from Kakar (2016), informed the development of our usability study.
Listing 14: MIAP Usability Requirement 1
Provide a view of all ranked hypothetical interactions at-a-glance.As in the original DIVA platform, viewing all the hypothetical interactions at-a-glance on the main screen is an essential requirement. Having designed the “Overview” view to be the root of all user interactions with the interface—it is where drugs and interactions are selected, filtered and searched for—we need to test how well the Overview provides this feature.
Listing 15: MIAP Usability Requirement 2
Facilitate differentiation between unknown hypothetical interactions
and already researched known interactions.
The mined data is going to include many reports for known drug interactions, so it is important to be able to tell them apart from the hypothetical interactions that need further research to confirm. We need to test if the method we used to differentiate them—solid lines for unknown, hypothetical, interactions, and dashed lines to represent known reactions—is sufficient for users to easily tell the two states apart.
Listing 16: MIAP Usability Requirement 3
Allow focus on select interactions for further study.The Galaxy View and Interaction Profile are parts of the visualization that are designed to provide focus on a select set of interactions beyond what is available in the Overview. We need to be able to see if they can provide the needed functionality, in that they get rid of uninteresting or unimportant drugs and interactions and allow for users to be able to keep track of them.
Listing 17: MIAP Usability Requirement 4
Facilitate the prioritization of focused interactions by various criteria.Prioritization is the key to being able to analyze a set of drug interactions. Once a user chooses or is assigned a group of drugs to examine, they need to be able to tell which is the most interesting, and that can depend on a number of criteria: the contrast scores of the interactions, the severity of the reactions, the number of reports for each interaction, or others. Therefore, we need to be able to test how well MIAP is able to prioritize interactions by different criteria.
Listing 18: MIAP Usability Requirement 5
Facilitate detection of severe ADRs.As discussed in Sec. 2.2, we need to be able to see when an interaction involves a serious reaction. Adverse reactions that threaten imminent death are going to be prioritized higher than those which are less dangerous, so we want to be able to test how easy it is to notice those severe reactions.
Listing 19: MIAP Usability Requirement 6
Provide access to the underlying FAERS reports.The underlying FAERS reports are the backbone of the evaluation process for confirming MDARs, and we need to test how easily available we have made those reports, as well as how accessible they are for the user to consume.
From these requirements, we developed a list of tasks that, if easily completed, would demonstrate that the MIAP platform had met those requirements. However, in its first iteration, this list included tasks that were easy for us, the developers, to complete in multiple views. We wanted our test to evaluate each view separately and show that the DIVA views added value to the system, so we refined our tasks to focus on one each view.
There were two phases to our qualitative evaluation experiment. First, we selected WPI students to interact with the interface in order to gain general insights of the usability of the system and whether it meets the requirements of the system a laid out in Sec. 5.2, which are based on those from Kakar (2016). Second, we met with domain specialists from the FDA to evaluate how well the tool meets their needs beyond the requirements they communicated with Kakar.
To recruit WPI students for the study we sought volunteers vial email, social media, and word of mouth, offering participants a chance to win one of a small number of incentives.
After we had recruited participants, a member of our team met in person with each participant separately to conduct the evaluation. To begin with, the participant was given a brief outline of the methodology used to conduct the evaluation in order to ensure that they were still okay with participating. If they agreed to continue participating, then we asked for their email address to use in the case that they won an incentive. They were then given a short overview (Sec. 9) of the purpose of the interface that we had developed along with some background knowledge necessary for a rudimentary understanding of how to interact with the interface.
Afterwards, the participant was presented with a series of tasks to complete using a set interactive version of the interface. While the participant was performing each task, they were asked to verbally indicate what they were trying to do and whether they were confused by anything. At the same time, the member of our team was taking notes regarding the participant’s level of frustration/satisfaction, time taken to complete the task, and any verbal comments that the participant made.
Following the completion of the tasks, the participant was asked a series of questions regarding their interaction with the interface and anything that they thought could be improved. The member of our team made notes as necessary. Then, the participant had the opportunity to ask any questions they might have had regarding our project. They were then notified that they would receive an email if they were later found to have won one of the incentives.
After all the WPI students had participated in our evaluation, a drawing was held to identify the winners of the incentives. Each student was be assigned a unique number from one to the number of WPI students who participated. For each incentive, a random number generator was used to randomly select a WPI student to win that incentive. If the same student was selected multiple times, we repeated the aforementioned process until all incentives were assigned to different students. Then, each winner of an incentive was notified via email, and a meeting was be arranged for them to pick up their incentive.
To recruit domain specialists from the FDA, we will contact members of the CDER that have assisted the research of Kakar and Xiao.
After we found domain specialists willing to participate in our study, a member of our team met in person with each specialist separately to conduct the evaluation. To begin with, the specialist was given a brief outline of the methodology used to conduct the evaluation in order to ensure that they were still okay with participating. Then, they were given a short overview of the interface that we have developed. Before seeing the interface itself, we asked the specialist to try and imagine how they might use this kind of tool.
Afterwards, the specialist was invited to explore the interface directly. We guided them through the tasks that we set out for the WPI students, and asked them to try and use the interface to accomplish the use cases they had mentioned previously, as well as any other way they might have intended to use it. While the specialist was working they were asked to verbally indicate what they are trying to do and whether they were confused by anything. At the same time, the member of our team took notes regarding the specialist’s level of frustration/satisfaction and any verbal comments that the specialist makes.
Following this, the specialist was asked a series of questions regarding their interaction with the interface, including whether they think the interface would help them in identifying adverse drug-drug interactions and anything that they thought could be improved to help them better do their job. The member of our team made notes as necessary. Then, the specialist had the opportunity to ask any questions they might have had regarding our project.
Both phases center around the requirements that we adapted from Kakar and Qin (2017–2018), in the design process. The tasks we developed from those requirements each focus on their own views in the application. We presented the tasks with relationships to the views we wished the subject to focus on when accomplishing the tasks, so that we could understand how well each specific view fulfilled the requirements set out for them. Our tasks, organized by view, were as follows:
This placeholder introduction to the Results chapter will introduce our results by citing a key result from each section of testing and provide the key analysis derived from that result, in brief, before transitioning to the first section.
This placeholder section is for discussion and analysis of the results of the technical tests we conducted to ensure the correctness and functionality of the backend portion of the MAIP application, which involved rewriting MARAS. We will discuss how these results show whether the system meets the goals we discussed in the last chapter.
This section is for the summary and analysis of the results of our user study, focusing on what our responses mean for the usability of our system. It will cite various quotations from our notes, which will be attached as appendices.
This placeholder introduction to the Conclusions transitions into the conclusion subsections by summarizing what the reader will encounter in each of the three subsections.
This placeholder subsection is focused on summarizing and concluding our specific work on the MIAP application, as well as wrapping up our testing and evaluation sections by talking about how they show that our work will help address the problems laid out in the background section.
This placeholder subsection is for discussing our experience as a team. We should talk about the things we learned from our project, and probably summarize the interpersonal relationships that went into it.
This is the section where we can talk about the things we would do if we had more time. We should come up with a list of features or tasks or research areas that we think will improve our platform and bring it to the place we want it to end up—as the tool the FDA uses to guide their evaluators’ research into MDARs.
Aronson, Alan R, and François-Michel Lang. 2010. “An overview of MetaMap: historical perspective and recent advances.” doi:10.1136/jamia.2009.002733.
“Drug Interactions API.” 2017. Accessed December 12. https://rxnav.nlm.nih.gov/InteractionAPIs.html{\#}.
Du, Mengmeng. 2005. “Approximate Name Matching.” NADA, Numerisk Analys Och Datalogi, KTH, Kungliga Tekniska Högskolan. Stockholm: Un, 3–15.
Fournier-Viger, Philippe, Antonio Gomariz, Ted Gueniche, Azadeh Soltani, Cheng-Wei Wu, and Vincent S Tseng. 2014. “SPMF: A Java Open-Source Pattern Mining Library.” The Journal of Machine Learning Research 15 (1). JMLR. org: 3389–93.
Gollapudi, Sunila. 2016. Practical Machine Learning. Packt Publishing.
Kakar, Tabassum. 2016. “MARAS: Multi-Drug Averse Reactions Analytic System.” Master’s thesis, Worcester Polytechnic Institute.
Kakar, Tabassum, and Xiao Qin. 2017–2018. “In Submission to Vast 2018.” Worcester Polytechnic Institute.
Kuhn, Michael, Ivica Letunic, Lars Juhl Jensen, and Peer Bork. 2016. “The SIDER database of drugs and side effects.” Nucleic Acids Research 44 (D1): D1075–D1079. doi:10.1093/nar/gkv1075.
Liu, Simon, Wei Ma, Robin Moore, Vikraman Ganesan, and Stuart Nelson. 2005. “RxNorm: Prescription for Electronic Drug Information Exchange.” IT Professional 7 (5). IEEE: 17–23.
Lloyd, Allison. 1999. “Dynamic Programming Algorithm (Dpa) for Edit-Distance.” http://users.monash.edu/~lloyd/tildeAlgDS/Dynamic/Edit/.
“MedDRA Hierarchy - How to Use.” 2017. Accessed December 12. https://www.meddra.org/how-to-use/basics/hierarchy.
Münch, Jürgen, Fabian Fagerholm, Patrik Johnson, Janne Pirttilahti, Juha Torkkel, and Janne Jäarvinen. 2013. “Creating Minimum Viable Products in Industry-Academia Collaborations.” In Lean Enterprise Software and Systems, edited by Brian Fitzgerald, Kieran Conboy, Ken Power, Ricardo Valerdi, Lorraine Morgan, and Klaas-Jan Stol, 137–51. Berlin, Heidelberg: Springer Berlin Heidelberg.
“Preventable Adverse Drug Reactions: A Focus on Drug Interactions.” 2016. U.S. Food and Drug Administration; Online. https://www.fda.gov/drugs/developmentapprovalprocess/developmentresources/druginteractionslabeling/ucm110632.htm.
“Questions and Answers on FDA’s Adverse Event Reporting System (FAERS).” 2017. Center for Drug Evaluation; Research. https://www.fda.gov/Drugs/GuidanceComplianceRegulatoryInformation/Surveillance/AdverseDrugEffects/.
“Questions and Answers on Fda’s Adverse Event Reporting System (Faers).” 2017. U.S. Food and Drug Administration; Online. https://www.fda.gov/Drugs/GuidanceComplianceRegulatoryInformation/Surveillance/AdverseDrugEffects/default.htm.
Tatonetti, N. P., P. P. Ye, R. Daneshjou, and R. B. Altman. 2012. “Data-Driven Prediction of Drug Effects and Interactions.” Science Translational Medicine 4 (125): 125ra31–125ra31. doi:10.1126/scitranslmed.3003377.
“Unified Medical Language System (UMLS).” 2017. U.S. National Library of Medicine. Accessed December 12. https://www.nlm.nih.gov/research/umls/.
[Introduction: Who we are, what our project is, what is DIVA?]
We are [names], and we are an MQP team working on the DIVA system. DIVA is a web application that visualizes drug interaction data so safety evaluators can more easily identify and investigate potential Adverse Drug Reactions, or ADRs. ADRs are unwanted side effects that are caused by taking one or more drugs; for example, taking Aspirin and Warfarin together can cause excessive bleeding. It can be especially difficult to discover interactions between multiple drugs in clinical trials, because it’s impossible to test every drug combination.
Our system uses data mining with adverse reaction data collected by the FDA to find likely ADRs caused by the interaction of multiple drugs. The DIVA platform allows users to examine the results of that analysis in a variety of ways. The potential ADRs found by the DIVA system are scored based on how likely or significant the interaction is.
Do you have any questions so far?
[Interface: Introduce each View]
Now we’re going to introduce you to the DIVA interface. Clicking on the question mark in the top-right corner will bring up a help menu that will give you a description of the system and walk you through the interface. Please open that help menu and read the contents now.
[Once they are done] Now we’re going to ask you to do a few tasks using the interface. Take as long as you need to complete each task. As you are working, tell us what you are thinking or feeling, what you’re confused by, and any other comments you have. If, at any point, you feel that you are unable to complete the task, just let us know and we can move on to the next one. Are you ready to start?
Data we will record during each task
Time elapsed while a participant is completing the task
Answer(s) given by participant in response to the task
The methodology that the participant used to complete the task
Level of guidance/assistance requested from the participant while completing the task
Comments from participants that indicate confusion or provide feedback as to the quality of the interface/system
[Tasks] - after each task, the participant will be asked to rate that task’s difficulty on a scale of 1 to 5, where 1 is very easy and 5 is very hard
Overview [R1]
[R3, R4]: Find 3 unknown drug-drug interactions.
[R2]: Find 3 drug-drug interactions with a score higher than [0.5]
Galaxy View
[R2, R5] Find and select drugs Trazodone, Metaxalone, and Tylenol. Of these drugs, which drug has the highest number of severe ADRs.
[R2, R3, R4] For drug Metaxalone, how many high scored [score > 0.2] and unknown interactions are there?
Interaction Profile
[R2] Please find what ADRs occur between drugs Trazodone and Diazepam.
[R6] How many reports support the above interaction?
[R2, R5] Find all severe ADRs associated with Trazodone’s interactions.
Report View [R6]
Please open the reports for the interaction between drugs Zoloft and Tylenol.
List the three most frequent drugs reported with the interacting drugs Zoloft and Tylenol.
Multiple Choice Questions
On a scale of 1 to 5, how easy was it to:
Interpret the information contained in the overview
Interpret the information contained in the galaxy view
Interpret the information contained in the profile view
Remember/decide which combination of operations to use to answer a question
Recover from errors once I realized a given approach would not lead me to the information I needed.
On a scale of 1 to 5, how visually appealing is the interface, where 1 is not appealing at all and 5 is extremely appealing?
[Open-ended Questions]
Which task was the most difficult to complete? What made it so difficult?
Which parts of the interface are the most difficult to understand? Why?
Which parts of the interface are the most difficult to use? Why?
Is there any way you could think of to make the interface easier to understand?
Is there any way you could think of to make the interface faster to use?
What would you change, if anything, to make the interface more visually appealing?
[Introduction: Who we are, what our project is, what DIVA is]
[Preliminary Questions]
What is your role at the FDA?
How do you work with ADRs and FAERS data?
[Introduction to DIVA platform]
[General Questions]
[Show them the Interface]
Here is the DIVA Interface. Clicking on the question mark in the top-right corner will give you a brief description of how to use the platform. Please open the help menu and read it now.
Do you have any questions about the interface?
Thinking back to how you said you would use such a tool, try to use the interface in each of those ways.
On a scale of 1 to 10, how useful do you think this interface would be for your day-to-day job, where 1 is not useful at all and 10 is invaluable?
What feature or features do you think are most useful to you?
What feature or features do you think would be least useful to you, if any?
What changes or improvements would you make to this interface to make it more useful to you as an FDA employee?
On a scale of 1 to 10, how difficult is this interface to understand, where 1 is not difficult at all and 10 is extremely difficult?
Do you have any additional questions or comments for us?